3/17/2026 | 8 Minute Read
Topics:

Labor costs have the greatest impact on the cost of goods sold (COGS) for IT solution providers, and they're often the business's largest expense. They can account for as much as 70% of total business expenses when you include employee wages, benefits, payroll, and other related taxes.
With so much at stake, do you know if what you’re paying your employees is reasonable compared to the market rate? Better yet, what are the top performers in your business model paying their employees?
The good news is you now have a resource that will provide you with the compensation data to:
The Service Leadership Index® 2026 Annual IT Solution Provider Compensation (Remuneration) Report™ is the leading source for business intelligence about compensation strategies of top-performing IT solution providers. This 500+ page report gives you total annual earnings (TAE), how much of TAE is variable, hourly bill rate for billable employees, and 2025 TAE increases and those planned for 2026 for 50+ IT solution provider positions by:
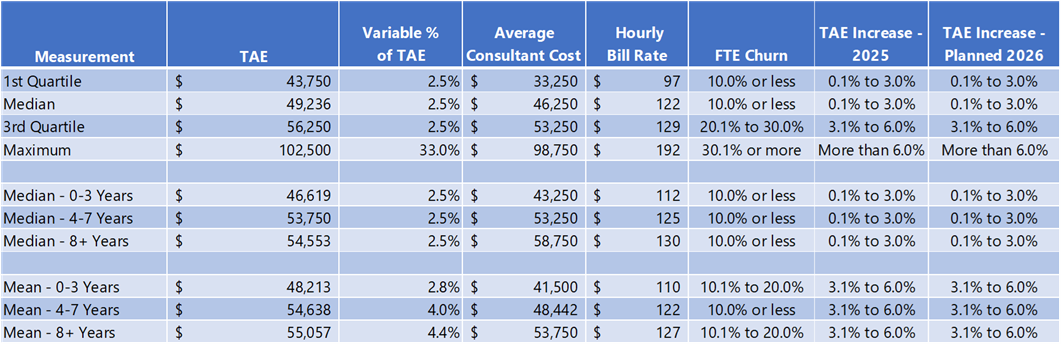
Figure 1: Sample position chart for a department/practice area
Unlike other compensation reports, which typically include enterprise IT and other positions only tangentially related to the IT solution provider business model, this report only includes data specific to IT solution providers. The survey participants were from around the world, including Canada, Ireland, Australia-New Zealand (ANZ), the United Kingdom (UK), and the United States (US). This provided us with a global view of what IT solution providers are paying their employees and allowed us to look into region-specific and aggregated data.
In addition, because Service Leadership, Inc.®, a ConnectWise company, benchmarks the industry’s financial performance worldwide every quarter through the Service Leadership Index®, we can uniquely correlate compensation data to IT solution providers’ profitability performance. In other words, we can tie compensation to profitability and show how top-performing companies pay differently than lower-performing ones. Let’s start with that.
When we analyzed the compensation and profitability data, we found a significant difference between what and how the best-in-class (BIC) IT solution providers pay their employees versus those in the median and bottom ¼ quartile. And we found this correlation not just in the US but worldwide.
The first difference is in the percentage of pay tied to the incentive compensation standpoint. IT solution provider profitability is closely correlated to the percentage of variable compensation paid for staff and non-owner management positions. As seen in the chart below, for staff positions in 2025, the BIC tied 8.6% of TAE to variable (incentive) compensation, while the bottom ¼ tied only 4.4%. For manager positions, the difference was even more dramatic. In manager positions, the BIC tied 16.9% to variable compensation, while the bottom ¼ tied less than half of that, only 7.8%.
In the comparison between 2015 and 2025, the BIC maintained consistent variable pay for staff and increased it for managers. This is because BIC IT solution providers understand the importance of a culture of excellence, and employees understand the benefit of variable pay, so exceeding expectations and outperforming can result in receiving higher compensation than market rates.
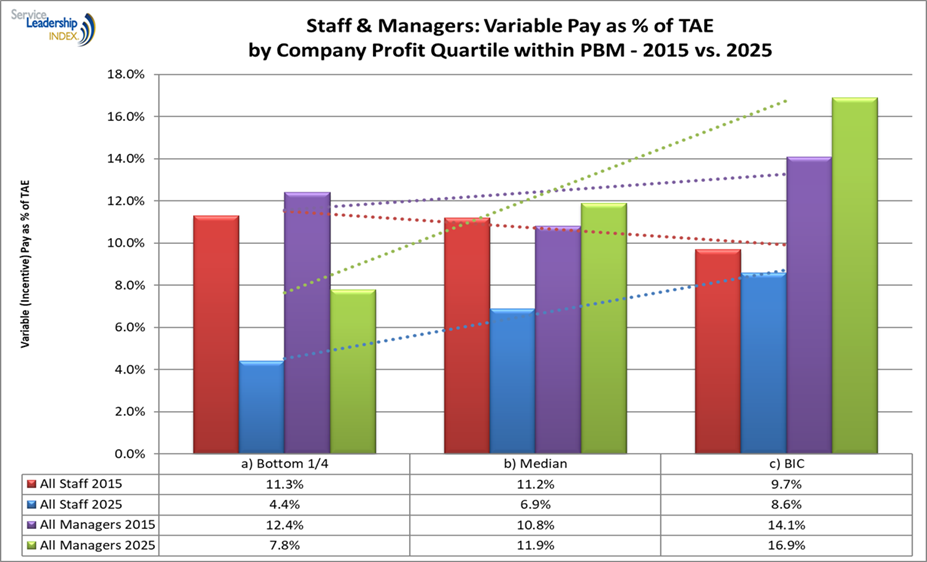
Figure 2: Graph of staff and managers’ variable pay percentage of TAE by company profit quartile within PBM - 2015 vs. 2025
A common response to learning that BIC are paying a higher percentage in variable pay is to assume that they are paying more overall. This is due to a widespread belief that more profitable IT solution providers are more financially successful and pay their employees more. In reality, the opposite is true. More profitable IT solution providers tend to pay less (lower TAE) for both staff and non-owner manager positions.
In fact, across all departments, the BIC pay about 8% less than the median and 15% less than the bottom ¼ for equivalent positions. Given the impact of payroll costs on services' gross margin and sales, and general and administrative (SG&A), this is a material factor in how the BIC can attain this level of profitability.
One key way the BIC (for all PBMs) accomplishes this is to narrow their range of technologies marketed and sold by sales, implemented by professional services, and supported by managed services. They also narrow the range of technologies sold and supported by narrowing the range of customer sizes they will sell to by user headcount. This is called a target customer profile. These two disciplines materially reduce the number, range, and cost of skills needed and thus allow IT solution providers to staff their teams with a higher percentage of lower-cost employees.
Our findings show that wage inflation peaked in 2022, with TAE increases declining in 2023 and remaining relatively stagnant in 2024. 2025 was a year of continuous decline in wage inflation, reflective of a cooling labor market as solution providers focused on prioritizing investments in automation tools to drive future efficiencies in their organizations. The continued decrease in wage inflation in 2026 suggests a return to historical norms. This is good news for IT solution providers as it should positively impact bottom-line profitability in 2026.
Data analysis corroborated the anecdotal evidence of lower wage inflation heading into 2026 across all PBMs and positions. Over 49% fewer positions are receiving planned top-level (over 6.0%) increases than in 2025.
In addition, there was a correlation between company profitability and the size of increases paid by IT solution providers in 2025. Bottom ¼ MSP companies issued approximately two times higher amounts of top-level raises to employees in 2025 than those of BIC MSP companies.
This is a material difference in payroll increases, which are even harder to absorb for the bottom ¼, many of which are already unprofitable. It is telling that the bottom ¼ MSPs are once again planning the highest percentage of top-level increases in 2026. This will put even greater stress on this already struggling group. These firms urgently need to adopt best practices, including cost management and pricing, or 2026 will be another difficult year.
The three “legs” of service profitability for all PBMs are rates, utilization, and wages. Efficiency is a fourth leg, found only in flat-fee firms, which is one reason well-run MSPs can achieve higher, sustained gross margin percentages. Because there is no uniform definition of utilization, we can more easily see a service practice’s effectiveness in generating gross margin by measuring the service multiple of wages.
This is a simple calculation: divide the billed service revenue for a given period by the taxable wages (W2 in US, T4 in Canada, etc.) of the employees required to deliver that service for the same period. Though the formula is simple, the impact on an IT solution providers’ profitability is pronounced.
An IT solution provider with a service multiple of wages of at least 2.5 drives BIC profitability, while a service multiple of wages of 1.9 to 2.0 will be needed to break even—or possibly at a slight loss—on their services business, assuming operating expenses are not also out of line. Below 1.9 will likely lead to a more significant loss.
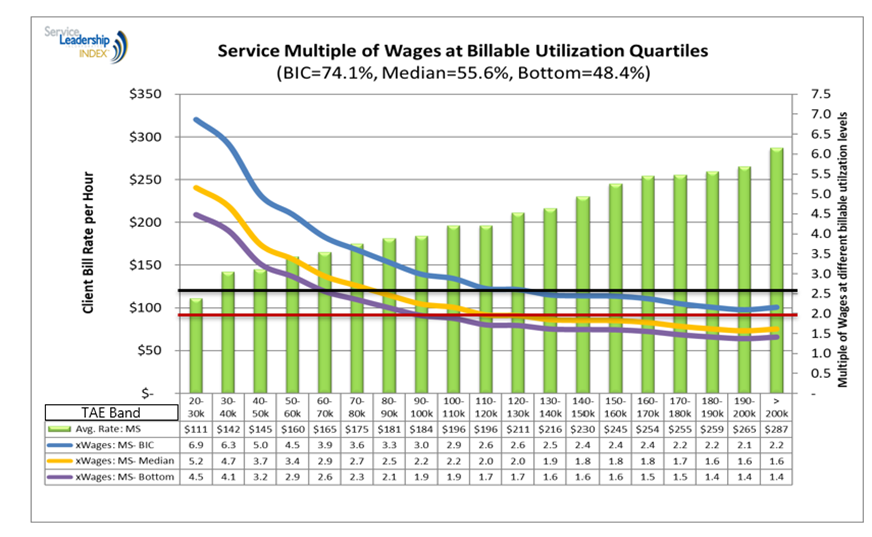
Figure 3: Chart of service multiple of wages at billable utilization quartiles
As the chart above shows, it’s generally not possible to make BIC services’ gross margin on any service employee whose TAE is above $90,000 at Median billable utilization.
As noted earlier, the BIC profitability firms:
The impact of these strategies underscores the importance of attaining a BIC service multiple of wages (2.5 or higher) for any IT solution provider, regardless of their chosen PBM, to attain BIC profitability and growth.
Understanding how your peers are compensating and what the top performers are paying is critical in running a consistently profitable IT solution provider. Compensation best practices leveraged by the BIC IT solution provider worldwide can be applied by any company seeking to attain and sustain top-quartile growth and profitability.
The full 500+ page report provides compensation trends in your PBM and region, along with how the BIC are compensating their employees. You can purchase the report here.
Share: