12/19/2025 | 20 Minute Read
Topics:

This is a quarterly newsletter courtesy of Service Leadership Inc.®, a ConnectWise company.
Metrics tell the quantitative story of a business. They allow owners and leaders to measure performance over time and to compare itself with other businesses – a practice commonly known as benchmarking. Metrics are used to inform decisions, strategies, and planning.
This article is unique in that it guides readers through a framework of metrics based on improving business valuation. Metrics are most often presented by department or priority, so the difference here relates more to the sequence of metrics presented rather than the specific metric itself.
This article is designed to educate readers about metrics commonly used by Private Equity (PE)-backed and larger MSPs (e.g., Empire Builder Mode) that could add value to smaller MSPs in other Modes (e.g., Value Builders, Balance Builders, and Startups). To be clear, the purpose here is not to repeat a review of more commonly known metrics. Ideally, readers may find and apply either the framework or new metrics to improve their business. Three clarifications are needed before beginning.
Rather than leave “commonly known metrics” undefined, Service Leadership identifies these two metrics as critical to any MSP.
Services Gross Margin % – This metric measures the company’s percentage of services revenue remaining after deducting the direct costs (e.g., Cost of Goods Sold) of delivering those services. Direct costs include labor, benefits, payroll taxes, software, tools, and other direct costs.
A high services gross margin indicates a company is efficient at managing its core service operating costs. Additionally, it increases the likelihood of generating sufficient gross margin dollars to fund Sales, General and Administrative (SG&A) expenses prior to making a profit.
The Service Leadership Best-in-Class Services Gross Margin = 48.7%
Service Multiple of Labor (or similar compensation total based on geography) – This metric assesses the efficiency of a service team by comparing the service revenue generated by that team to its fully loaded payroll expenses. This metric provides a quick and easy way to gauge the financial performance and productivity of a service team.
The Service Leadership Best-in-Class Service Multiple of Labor = 2.8.
The Purpose section above refers to four Modes Mindsets. Collectively, these form Modes Theory™, a framework for a common language to understand and align growth mindsets. They serve as a lens to clarify growth mindsets in any business and any person.
Additional information about Modes is available by completing the Modes Assessment. For this article, it’s important to understand 1) an MSP’s Mode is typically related to its Operational Maturity Level™ (OML), and 2) as a result, different metrics may be useful to MSPs in different Modes.
Here are short descriptions of each Mode:
To identify metrics used by Empire Builders that may be useful to MSPs in other Modes we:
This methodology was intentionally non-scientific. The goal was to be directionally correct (e.g., broadly accurate) given the ability and goal to highlight multiple metrics in this article.
This article proposes a framework consisting of five outcomes which form an interdependent flywheel effect. The ongoing, ultimate outcome is continuous maximization of business value:
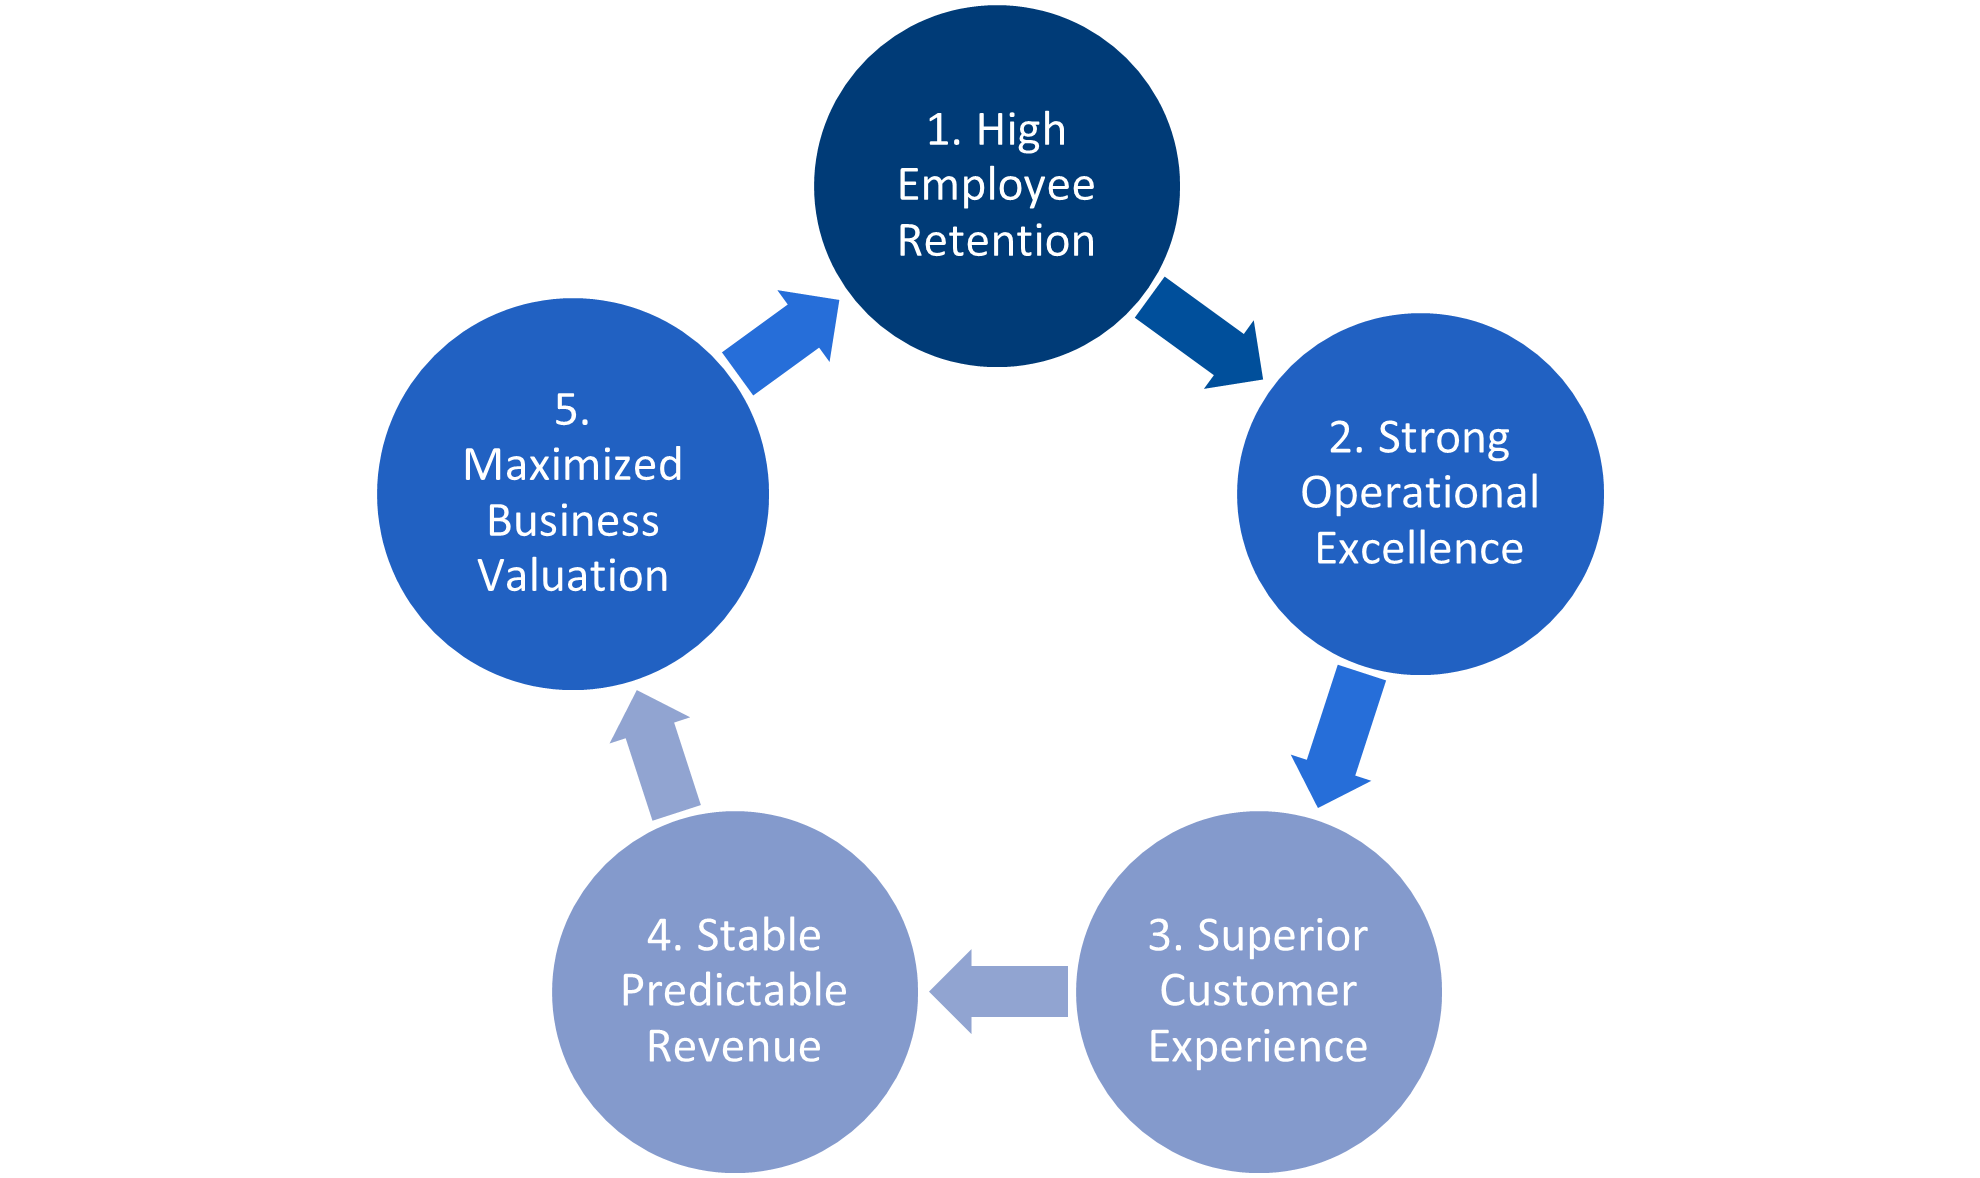
Figure 1: Flywheel of Business Growth
Why Use a Story Framework to Increase the Adoption of Metrics?
A picture may say 1,000 words, but an impactful story can improve retention and adoption. In the case of the “Flywheel of Business Growth,” the story involves the “end in mind” goal of Empire Builders who grow their platform to eventually exit. Each acquisition or merger comes with complexities, challenges, and opportunities for synergies to – you guessed it – maximize business value of the combined entity…the goal of the framework.
Several Empire Builders said the “Flywheel of Business Growth” is a general representation of how they hold conversations with employees of newly acquired companies. Starting at the top (Outcome 1), buyers (acquirers) want to retain most employees from the sellers (acquirees). Telling (or showing) employees this fact reduces anxiety and aligns the goals of both parties.
Moving on, employees understand the need for strong operational excellence, commonly referred to in the MSP industry as Operational Maturity Level™ (OML). Gaining employee buy-in of the importance of operational excellence can help with the integration between companies in the short term. The company and teams identify which new processes to follow and which metrics to measure them by.
In the long term, employees see the linkage between their roles and delivering superior customer experience. Roles, teams, and size may change, but the expectations of the customer and metrics change little. Superior customer service may be the most direct outcome for employee alignment. Most employees desire to serve customers well and understand how customer experience is important to business value.
With a well-served, loyal, and growing customer base comes stable, predictable revenue. This outcome is qualitatively logical, but employees may benefit from a demonstration of the Rule of 78 to show the importance of adding consistent monthly recurring revenue (MRR). (e.g., Month 1 is counted 12 times per year, month 2 is counted 11 times per year, etc. until 12+11+10+ … +3+2+1=78.) Missing out on selling new MRR agreements, especially early in the year, makes achieving annual MRR budget targets difficult.
Employee retention is key to maximizing business value. It yields a variety of benefits including tenured staff, consistent culture, knowledge of policies and procedures, and relationships among team members. At the same time, retaining employees who are slow to adapt to change (such as AI), reluctant to assume new responsibilities, or who poison the company culture can negatively impact the company in a variety of ways, which ultimately impair business value growth. In addition to consistent 1:1 meetings, team meetings, employee surveys, and annual reviews, Empire Builders use three primary metrics related to measuring employees:
Employee Turnover Rate (also known as Employee Churn) is the inverse of Employee Retention. (e.g., if the turnover rate is 10% the retention is 90%.) The Employee Turnover Rate is a measure of the percentage of employees who leave the company over a period of time. The turnover rate indicates the health of the business, potential issues within the business, and employee satisfaction.
Employee turnover rates are most often calculated at the company level, though larger businesses may calculate rates at the department, team, or role levels. One formula is:
Employee Turnover Rate = (# of Employees Who Left / Average # of Total Employees) x 100
For example, assume an MSP had 50 employees at the beginning of the year and 5 employees left during the year. The monthly average headcount was (50+51+50+49+48+47+47+46+47+ 47+48+49) 579 total or 48.25 average per month. The employee turnover rate is (5 employees who left / 48.25 average monthly employees) x 100 = 10.4%.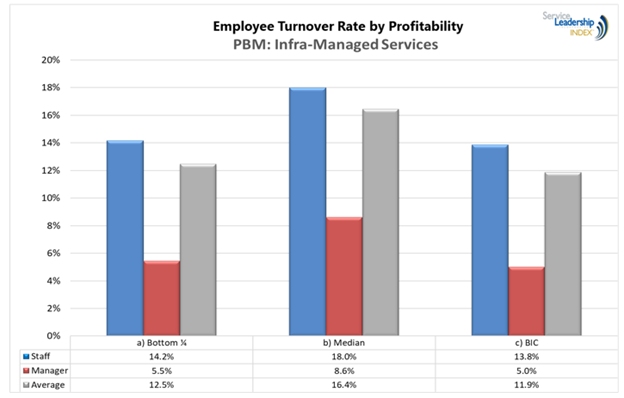
Figure 2: Employee Turnover Rate by Profitability
Figure 2 illustrates the breakdown of employee turnover rate by profit quartile for MSPs. The BIC have the lowest churn at 11.9%, followed by the bottom ¼ at 12.5%. The distinction between BIC and bottom ¼ lies in retaining employees. BIC strategically retain specific employees while being more accepting of others leaving. They are more disciplined with their focus on a narrow tech stack and target client profile (TCP) which allows them to operate with less experienced resources.
Alternatively, the bottom ¼ tends to be less focused on their tech stack and TCP, which requires them to retain more senior employees at higher costs and limits growth opportunities for less-experienced employees.
Employee satisfaction attempts to measure the level of contentment and happiness that employees feel about their job, work environment, and overall experience within an organization. We say “attempts” because these surveys may be biased based on question wording or openness of responses. High levels of employee satisfaction can lead to increased productivity, better employee retention, and a positive work culture – especially if employees believe managers truly value and will work to apply their feedback.
Employee satisfaction is typically measured periodically (e.g., quarterly, semi-annually, annually) using survey tools that are customizable. Surveys may be anonymous, though this feature is less possible in smaller organizations or teams as responses are not part of a larger population.
Service Leadership does not benchmark Employee Satisfaction due to the breadth of types of surveys.
eNPS is a metric used to measure employee loyalty and engagement within an organization. It parallels the customer Net Promoter Score metric discussed below. The metric is calculated by asking employees how likely they are to “recommend our organization as a place to work to a friend or colleague” on a scale of 0 to 10, then subtracting the percentage of “Detractors” (0-6) from “Promoters” (9-10).
Both eSAT and eNPS metrics are important due to employee retention, productivity, talent attraction, employee well-being, and strengthening of culture. These factors are core to a healthy business and its ability to achieve high employee retention in support of maximizing business value.
Service Leadership does not benchmark eSAT or eNPS.
Without a framework and story, the tendency may be to directly connect the efforts of employees to the experience of customers. This is not wrong but is incomplete. The so-called “Service Factory” operated by each MSP includes its own set of processes which produce experiences and are measured by metrics. Therefore, the connection between employee retention and customer experience is the MSP’s ability to deliver strong operational excellence.
One overarching way to measure this level of excellence is through the well-documented model of Operational Maturity Level (OML). In general, Empire Builders have higher OMLs than MSPs in other Modes. The expanded focus on Service Factories, OML, Professional Service Automation (PSA), Remote Monitoring and Management (RMM), NOCs/SOCs, Cybersecurity, and now Robotic Process Automation (RPA) and AI have created a huge number of potential metrics – so choose wisely.
To maintain focus in this article, three metrics that Empire Builders use to link employee performance to superior customer experience are:
FRT measures the average time between a client submitting a request or reporting an incident and an MSP’s technician initiating a human response. It is calculated by taking the time of the first human response minus the time of the customer query and then averaging these durations across all tickets. Interestingly, studies suggest that clients often prioritize the speed of the initial response, even over a more thorough response that takes longer to formulate. A low First Response Time is a key driver of customer satisfaction, as prompt responses demonstrate attentiveness and reassure clients that their issues are being actively addressed.
Note that FRT currently reflects a “human response” and not immediate autoresponders to client tickets. However, as RPA and AI tools advance in personal responses, FRT values may approach zero due to personalized, high-quality autoresponders. The definition of FRT may be revised.
Service Leadership does not benchmark FRT.
FCR is the percentage of client issues that are resolved successfully during the very first interaction with the support team, without requiring escalation or subsequent follow-up contacts. It's calculated by dividing the number of tickets resolved on first contact by the total number of tickets received, then multiplying by 100. A high FCR is a strong indicator of an efficient service desk, knowledgeable technical staff, and well-documented solutions. It significantly enhances customer satisfaction by minimizing client effort and reduces operational costs by avoiding repeated handling of the same issue.
As with FRT above, FCR is undergoing change as customer interactions with AI lead to more first contact interactions using chatbots, for example. The definition of “support team” will expand to include digital AI workers.
Service Leadership does not benchmark FRC.
MTR tracks the average time taken to completely resolve a client's issue or incident; from the moment it is reported until it is closed. This is typically calculated as the total resolution time for all issues divided by the number of resolved issues within a period. Mean Time to Resolution directly impacts client productivity and their perception of the MSP’s efficiency. A shorter MTR indicates more effective problem-solving processes and better service quality, leading to reduced business disruption for clients.
The addition of AI support tools and digital workers to reduce resolution times will impact the definition of MTR and how it is benchmarked.
Service Leadership does not benchmark MTR.
Additional Metrics
Service Level Agreement (SLA) Compliance: This metric measures the extent to which the MSP meets the agreed-upon service levels and performance targets outlined in the SLA documents with its customers. These targets often include specific thresholds for uptime, response times, and resolution times. SLA compliance is typically calculated as: (Number of SLA-compliant incidents / Total number of incidents) x 100. Consistently meeting or exceeding SLA commitments is crucial for demonstrating reliability and delivering services as promised. Frequent SLA compliance failures or breaches can quickly erode client trust and may lead to contract terminations or non-renewals.
While meeting SLAs is fundamental, MSPs aiming for exceptional customer loyalty and differentiation should set goals to exceed these contractual minimums. Consistently outperforming SLA targets, particularly for critical metrics like FTR and MTR, can be a significant differentiator and a powerful driver of "Promoter" scores in NPS surveys, which in turn can lead to valuable organic growth through referrals. These outcomes demonstrate why strong operational excellence contributes to the next outcome in the framework and to maximizing business value.
While “the customer’s always right” axiom is often used to prioritize customer experience over all else, reality has shown that engaged and self-motivated employees drive the highest quality customer experience. This is why Outcome #3 is a result of achieving Outcome #1 (High Employee Retention) which drives the flywheel gear of Outcome #2 (Strong Operational Excellence).
Metrics that larger MSPs use to drive Superior Customer Experience (Loyalty) include:
CSAT typically measures customer satisfaction following specific interaction, such as the resolution of a support ticket or completion of a project. It offers immediate, actionable feedback at specific touchpoints which can be used for corrective action. Results from questions such as, “How would you rate your overall satisfaction with the service you received?” on a scale of 1 to 5 are easily interpreted with dashboards employees can view.
NPS measures customer loyalty, typically by asking "On a scale of 0 to 10, how likely are you to recommend our company/services to a friend or colleague?" Responses are categorized into Promoters (score 9-10), Passives (score 7-8), and Detractors (score 0-6). The NPS is calculated as the percentage of Promoters minus the percentage of Detractors. A positive NPS indicates a degree of customer loyalty and potential for organic growth through word-of-mouth referrals. A low or negative NPS, however, signals issues that require urgent attention to prevent further erosion of client relationships.
NPS surveys are sent less often than CSAT surveys. They may be sent to leader(s) or decision maker(s) in the customers’ organization who oversee services and own relationships with the MSP.
Service Leadership benchmarks NPS for the Annual Profitability Report. As shown below, MSPs report a range of NPS from 51.2 for Bottom ¼ profitability to 68.7 for BIC profitability.
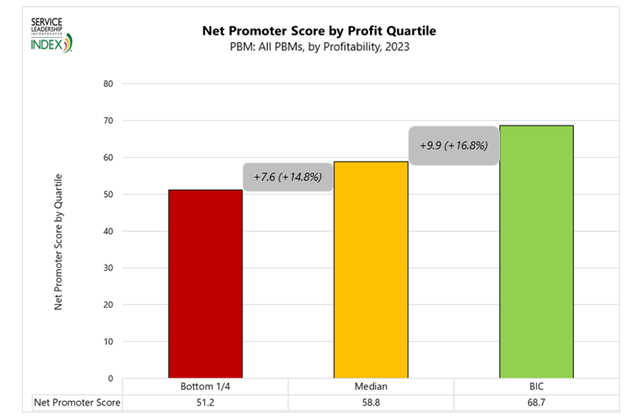
Figure 3: Net Promoter Score by Profit Quartile
MSPs experience two main types of retention (or churn) issues: customer and revenue (discussed in Outcome #4 below). Customer retention is the most basic churn metric. It represents the percentage of customers lost during a specific period and is calculated on a “gross” basis. (e.g., Start with 100 customers, lose 5 of the original customers, the churn rate is 5% and does not count new customers.)
Note that “churn rate” is the inverse of retention rate. For example, a 90% retention rate reflects a 10% churn rate. It’s important to understand and measure both retention metrics, though starting with customer losses, and treating each loss on a case-by-case basis is often most insightful. For example, an MSP may lose 5 customers with an average of $5,000 in MRR each ($25,000 MRR total) compared to one customer with $25,000 in MRR. The total revenue lost (or churned) is the same in both cases, but the reason for each customer leaving may be .
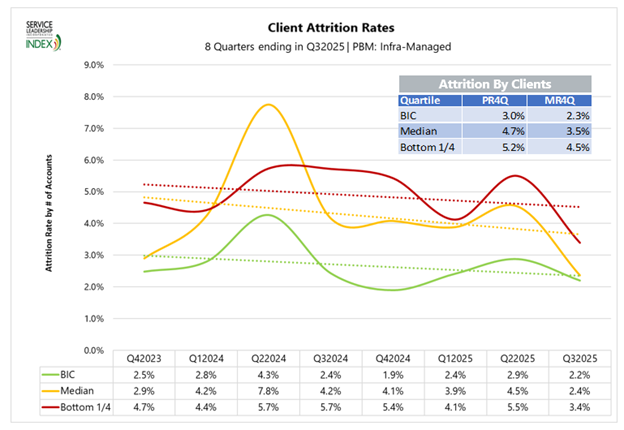
Figure 4: Client Attrition Rates
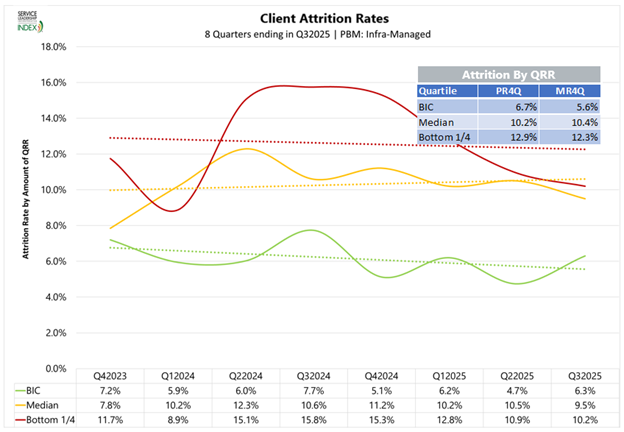
Figure 5: Client Attrition Rates
Related Metrics
Interestingly, larger MSPs (and therefore most MSPs) do not often use Customer Lifetime Value metrics (CLV or LTV for short). Customer lifetime value is the total amount of potential revenue (or potentially gross margin dollars) a customer could generate throughout their relationship with your company. The ‘lifetime’ refers to the span of your working relationship.
In the technology industry, where many MSPs rely on a recurring revenue model, average LTV can often exceed $100,000 per customer. Recognizing this, many companies today are investing heavily in customer retention as mentioned above, rightfully viewing customer relationships as long-term investments worthy of time, resources, and maintenance.
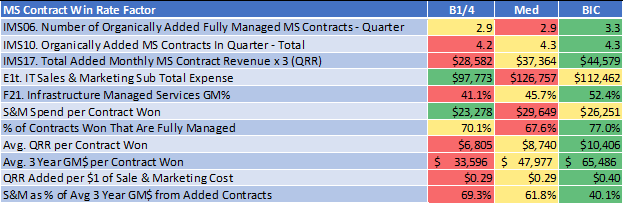
Figure 6: Managed Services Contract Win Rate Factor
From the 2025 Annual IT Solution Provider Industry Profitability Report, Figure 6 shows that the BIC receive on average $65k on a 3-year GM$ per contract won (this includes only monthly recurring revenue and not products or projects). This is nearly 2X the return compared to the Bottom ¼ average of $34k. The BIC maximizes ROI on sales and marketing investments by strategically targeting prospects who exclusively opt for their fully managed service contracts (77% acceptance rate).
This approach yields the highest average contract value ($10,406) and the highest GM % for managed services (52.4%), which in turn produces higher 3-year GM$. Given the constraints of limited sales and marketing resources, it is crucial to prioritize high-value opportunities to optimize ROI.
Assuming the previous three Outcomes are achieved, the MSP is positioned to deliver stable, predictable revenue on its continued path to Maximizing Business Valuation. While different business models produce different levels of predictability, the Managed Services Predominant Business Model (PBM) has historically delivered the greatest stability.
PE-backed MSPs and large MSPs who are Empire Builders indicated extensive use of three primary revenue metrics:
ARR is used to track predictable and repeatable revenue over the course of a year. One-time sales, projects, or assessments are not included. ARR takes a long-term view by annualizing revenue instead of variations in MRR. ARR is helpful in making strategic decisions as well as attracting investors or buyers based on predictable performance.
In Outcome #3 (“Superior Customer Experience”) we discussed the importance of tracking Customer Retention (or Churn). It’s important to understand and measure both retention metrics, start investigating losses, and treat each loss on a case-by-case basis. Empire Builders typically report revenue retention based on two related metrics:
GRR reflects an MSP’s ability to retain customers. It calculates total revenue (excluding expansions) minus revenue churn (contract expirations, cancellations, or downgrades). Gross revenue does not account for expansion revenue. Gross retention shows the core strength of the customer base.
NRR reflects an MSP’s ability to retain and expand customers. It calculates total revenue (including expansions) minus revenue churn (contract expirations, cancellations, or downgrades). Net retention provides a more complete picture of how a company is growing revenue from its current customers than does gross retention.
Large MSPs varied in their use of Bookings vs. Billings, but many of those who used the metric used it extensively. Bookings and Billings represent different points of time in the revenue cycle of a business. Bookings indicate a commitment to future revenue, while billings indicate current cash flow and financial health.
Bookings indicate the total contract value of new sales orders or commitments. Billings reflect the actual amount invoiced in a period. For example, if a customer signed a two- year agreement for $72,000, the booking value is $72,000, while the billing value is $3,000 if billed monthly.
Related Metrics
Larger MSPs also expressed some use of Customer Acquisition Cost (e.g. CAC or “new logo acquisition cost”) which Service Leadership reports at $26,000 per customer.
As is often the case, simply measuring the metric produces less value than observing patterns and trends, then comparing those values to BIC or industry benchmarks. For example:
What are the changes in New Business MRR? This metric indicates successful and strong sales and marketing strategies, relevance in the chosen market, and effective lead conversion.
Conversely, what are the changes in Expansion MRR? (e.g., upselling and cross-selling existing clients) Expansion MRR is an indicator of customer satisfaction, trust, and the MSP’s ability to deliver value over time.
Finally, what are you learning from trends in Average Revenue Per Account (ARPA)? (total MRR divided by the number of customers) ARPA measures whether customer relationships are deepening and value delivered is increasing (higher ARPA), or if efforts are being diluted across many low-value accounts (lower ARPA).
Maximizing business value is the ongoing, and final, outcome of the flywheel of metrics discussed in the previous four outcomes. Each outcome alone is valuable, but until they are connected as a framework the metrics operate in silos. Business valuation metrics are, by definition, directly related to the “Flywheel of Business Growth.”
Large MSPs were clear when asked which valuation metrics they use extensively:
EBITDA growth positively impacts a business’ value because higher, growing earnings indicates strong performance and future profitability. This leads to higher EBITDA multiples and an increased valuation. EBITDA growth indicates operational efficiency, strong cash flow, and a greater ability to fund future growth.
Note that related metrics, Adjusted EBITDA and Adjusted EBITDA Growth, are more commonly used in financial benchmarking. The EBITDA metrics are “adjusted” by adding back or subtracting non-recurring, one-time, or unusual expenses to present a more accurate financial picture of the business. These adjustments may include restructuring costs, one-time professional fees, or gains/losses on asset sales to focus on the core, sustainable business.
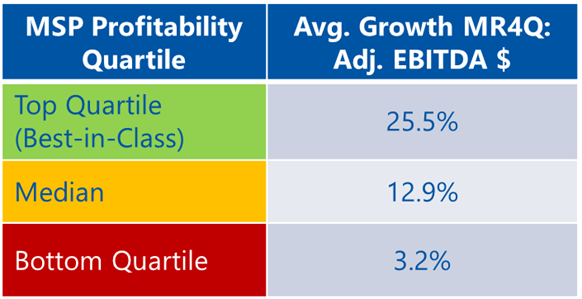
Figure 7: Adjusted EBITDA $ Growth by profit quartiles over MR4Q
Figure 7 illustrates the difference in Adjusted EBITDA $ growth. BIC has achieved 25.5% total revenue growth over the Most Recent 4 Quarters (MR4Q) as of Q3-25 which is around double the Median quartile of 12.9% and significantly larger than the Bottom ¼ of 3.2%.
Revenue growth is a key metric for tracking business performance. It helps evaluate marketing, product, service, and management strategies. Tracking revenue growth helps evaluate forward momentum, measure the maturity of forecasts, and therefore attract investors to a predictable business.
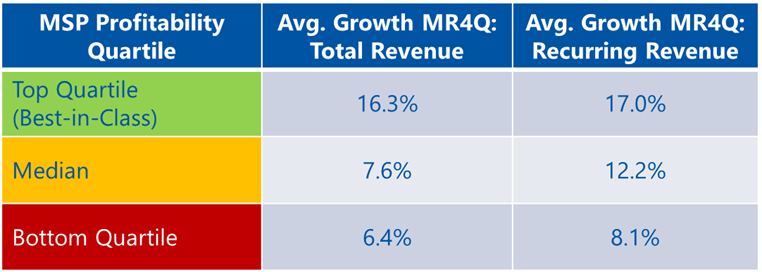
Figure 8: Total Revenue & Recurring Revenue Growth by profit quartiles over MR4Q
Figure 8 illustrates the difference in total revenue and recurring revenue (cloud and managed services) growth. BIC has achieved 16.3% total revenue growth over the Most Recent 4 Quarters (MR4Q) as of Q3-25 which is more than double the Median quartile of 7.6% and Bottom ¼ of 6.4%. The BIC are able to achieve higher growth due to maintaining lower client churn as well as only targeting customers that are an ideal fit for their fully managed service contracts which are sold at higher MRR amounts.
MSP organic (e.g., non-acquisitive) growth is the increase in a company’s revenue from internal efforts and resources such as improving existing products, developing new ones, enhancing marketing, and increasing operational efficiency (Outcome #2). Examples of organic growth in new products include cloud services, enhanced cybersecurity, specialized consulting, AI advising, and more advanced managed services.
Organic growth removes acquisitions from the picture of overall company growth, performance, and strength. It demonstrates whether the company’s strategies and operations are working and predicts whether the company can grow without acquisitions.
Related Metrics
Valuation Multiples are financial ratios that use a company’s market value and a key financial metric to provide a standard, comparable value. Another common financial metric related to multiples is “revenue for line of business” as each type of revenue (e.g., business model) is valued differently.
Most often, the valuation multiples help measure the company’s total value, including debt, relative to its operational performance. The multiples offer a quick market-based valuation but require more careful understanding of each use case. Multiples must be applied in the correct context, with an understanding of accounting differences, cumulative ARR, and other variables.
Observations
This article presents an integrated framework of key metrics used by private equity-backed and larger Managed Service Providers. It introduces the “Flywheel of Business Growth,” a structured approach to connecting what are often standalone metrics with interrelated outcomes to show increases in business value.
Thomas Edison said, “Vision without execution is hallucination.” The parallel quote for metrics may be “Metrics without execution is data.” The opening paragraph of this article proposed that properly designed and applied metrics improve decisions, strategies, and planning. Here are reminders of next steps you may take to apply metrics in your business based on decisions by PE-backed and large MSPs.
Next steps: Reminder of Key Strategies of Top-Performing MSPs
This framework provides MSPs with a value-based perspective on practical metrics as found in PE-backed and larger MSPs. It aligns employee efforts, operational processes, customer satisfaction, and revenue stability with growth in business value. Simply put, the “Flywheel of Business Growth” supports opportunities for maximizing the value of your business as you choose.
Share: