4/18/2023 | 5 Minute Read
Topics:

Data isn’t valuable in and of itself. As with anything, you need to give form to data for it to mean anything to your audience. For MSPs, this can often mean taking complex figures about a client’s organization and presenting them in a way that’s easy to understand.
What you may not know is that doing so isn’t necessarily a complicated task — not with the help of business intelligence (BI) dashboards. If you can represent data intuitively, you can do a lot of heavy lifting without excessive work.
Want to know more about the benefits of BI dashboarding? Read on.
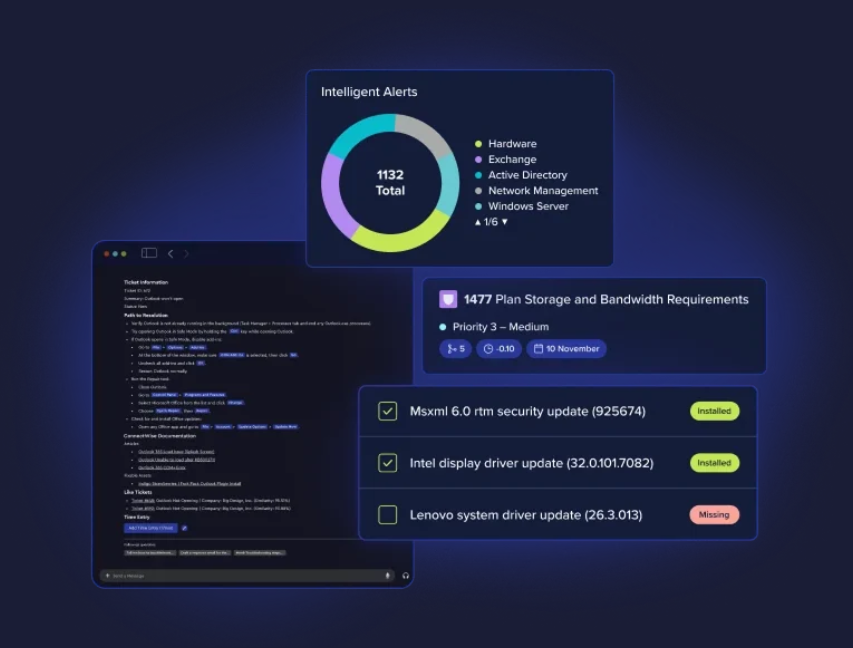
A business intelligence dashboard is a tool that displays key performance indicators (KPIs) and other important business metrics in a visual format. This makes it easier for your teams to monitor internal performance and make data-driven decisions by providing near-real-time insights into client operations.
Dashboards for business intelligence include, among other visualizations:
Data visualizations get information across intuitively. By providing a comprehensive view of key metrics, a BI dashboard helps your team identify trends, track progress towards goals, and make the kind of informed decisions that drive client and internal success, all in a format that helps readers grasp what’s going on without undue effort.
A business analytics dashboard commonly includes a range of features designed to help MSPs analyze and visualize data in a meaningful way. Some of those common features include:
Simply put, a dashboard’s meaning in business analytics is to make the visualization, presentation, optimization, and sharing of data simpler. Check out our webinar, Unlocking the Power of Your Data with Reports and Dashboards (formerly BrightGauge), for advice on how to get started.
If you’re wondering how to increase your profit margins, consider a business dashboard right up front. A dashboard for BI provides numerous benefits specifically for MSPs, including:
For more information on how business dashboards help businesses like yours grow, check out our webinar, Get Your Business Off the Sidelines with Business Intelligence.
Here are some best practices for creating effective business intelligence dashboards:
By following these best practices, you can create a dashboard that simply and straightforwardly provides valuable insights to both your team and your client. Be sure to check out our blog for more essential tips for BI dashboard usage.
Business intelligence dashboard software helps streamline operations, improve services, and grow a client’s business. Real-time visibility enables enhanced decision-making, which can help you stay competitive while meeting the growing needs of your clients.
Ready to take the next step? Explore Reports and Dashboards (formerly BrightGauge) to learn how next-level business intelligence can drive efficiency and profitability for your MSP.
Share:


A business intelligence (BI) dashboard differs from a traditional report in several ways:
Yes, a business intelligence (BI) dashboard can integrate data from multiple sources. In fact, one of the key advantages of BI dashboards is their ability to consolidate data from disparate sources and provide a single, unified view of a business's operations.
By integrating data from multiple sources, a BI dashboard can provide MSPs with a comprehensive view of client business operations, including financial, operational, and customer-related data.
The frequency with which a business intelligence (BI) dashboard should be updated depends on the needs of the MSP and the type of data being tracked. In general, the more frequently the data changes, the more frequently the dashboard should be updated to reflect those changes.
Here are some best practices for designing a business intelligence (BI) dashboard:
Yes, a business intelligence (BI) dashboard can be customized for specific users or departments. Customization is one of the key benefits of BI dashboards, as it allows users to view the data that is most relevant to their role or responsibilities.
Customization can take many forms, including:
Data governance plays a critical role in ensuring the accuracy, reliability, and security of the data used in business intelligence (BI) dashboards. Data governance encompasses the policies, procedures, and controls used to manage data throughout its lifecycle, from creation to disposal. Here are some ways in which data governance can impact BI dashboards:
There are several types of dashboards, but here are three common types: