This is a quarterly newsletter courtesy of Service Leadership Inc.®, a ConnectWise company.
Profitability is a skill that can be learned.
For over 20 years, Service Leadership has served the IT industry. First, as consultants sharing knowledge and best practices, and most notably as the creators of the Service Leadership Index—the largest, longest-running, most detailed, and most accurate IT solution provider benchmark in the industry. Service Leadership also developed SLIQ, an operational maturity assessment tool designed to help IT solution providers leverage best practices for building profitable, high-quality growth. Both offerings are built on decades of knowledge about building, growing, and scaling IT solution provider companies through disciplined strategy, operational excellence, and people-first leadership.
Although the IT industry is widely known for the dizzying rate of change, in reality, the core foundational elements for operating, optimizing, and scaling IT solution provider businesses remain largely unchanged. ConnectWise has and will continue to invest in the further development of Service Leadership for both the Benchmarking and SLIQ products, recognizing that these products advance the objective of helping IT Solution Providers be more successful. The core principles that guided the creation of Service Leadership, Inc. remain relevant today.
In this first quarterly newsletter of 2026, we are focusing on the “First Principles” that fundamentally underpin our learning and guidance. With the growing AI opportunity in the industry, it is more important than ever to remember that these fundamentals are still true today.
What you think is a "secret sauce" is likely neither secret nor unique.
A common response when we share what we’ve learned from the data and studying the most consistently profitable IT solution providers is that the guidance we provide doesn’t apply to certain IT solution providers because “we’re different.” This is (incorrectly) rooted in a belief that they have some proprietary method or people who are better than average. This difference leaves them believing our guidance is something others should adhere to, but not them. That perspective is not only incorrect but also restrains them from making decisions and ultimately achieving better results, like best-in-class (BIC) companies do.
In our experience, it is:
Collectively, these elements are the building blocks used by best-in-class solution providers to outperform their peers consistently.
There are many ways to run an IT solution provider business, both financially and operationally. We recognize these different models in a way that goes beyond common industry designations like value-added reseller (VAR), reseller, and systems integrator. Those terms don’t fully reflect the fundamental financial and operational differences that matter when comparing performance and applying best practices.
The success ratios for a best-in-class product-centric firm are quite different than those for a best-in-class services-centric firm, such as a managed services provider (MSP).
The same is true for best practices. The steps needed to add managed services to a product-centric firm differ from those for a project-centric firm. Similarly, the best methods for selling projects within a project-centric firm differ from those for selling projects within a managed services firm. As with benchmarking, applying an inappropriate best practice is, at best, a waste of time and resources and is counterproductive. At worst, it can lead to decision-making that drives lower performance. As a result, starting in 2007, Service Leadership made public its predominant business model (PBM) structure, which we have used since 2001 as our primary method of categorizing IT solution providers and the best practices suited to each business model.
Why PBMs? The predominant business model structure enables apples-to-apples benchmarking of actionable business drivers, allowing you to determine which management techniques and decisions produce the best results.
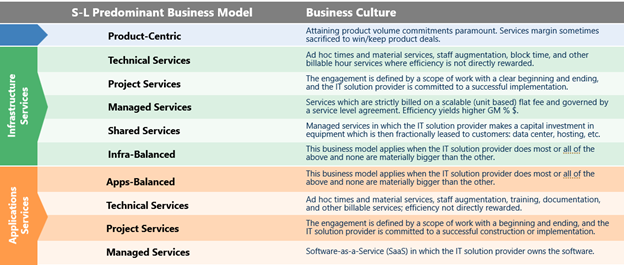
Figure 1: Predominant business models
How do you know what good looks like in terms of financial performance? For each PBM, we break out financial performance into three categories:
1. Best-in-class (“BIC” or “top quartile”)
When referring to EBITDA (earnings before interest, taxes, depreciation, and amortization), this is the EBITDA % required to get into the top quartile of EBITDA% in the specified PBM. When referring to other metrics, this is the average of the metric for those in the top quartile of EBITDA %.
2. Bottom Quartile
When referring to EBITDA, this is the EBITDA % required to fall into the bottom quartile of EBITDA% in the specified PBM. When referring to other metrics, this is the average of the metric for those in the bottom quartile of EBITDA %.
3. Median
When referring to EBITDA, this is the median EBITDA% (50th percentile) within the specified PBM. When referring to other metrics, this is the average of that metric for firms that fall in the middle (median) EBITDA% band.
Achieving BIC performance is a realistic goal for every IT solution provider, no matter the PBM. Proper management visibility into your financial statements and benchmarking to compare with what BIC companies are doing is key to learning to make good, consistent decisions in running your business.
Top performers (BIC) in each business model and in all geographies earn about 2.5 times higher bottom-line profit percent (adjusted EBITDA %) than their median peers, regardless of their size, age, owner compensation, geography, client profile, or vendor selections.
That is about 2.5 times higher cash flow and 2.5 times higher stock value, doing essentially the same things for the same client profiles, regardless of geography. We believe this is a fair return for the value they deliver: Because 25% of all IT solution providers attain this, we believe all IT solution provider owners and executives should—and with diligence—can perform at this level.
Virtually all IT solution provider management teams that generate sustained high financial performance are not only great technologists and functional operators but are also very good at managing by their profit and loss (income) statement and balance sheet.
Many small business owners did not go to school for business finance. They likely rely on the help of a tax accountant and the templates built into their first accounting software package to build out their initial chart of accounts. They record transactions to ensure they pay proper taxes and can properly send and receive checks. They may or may not care about monthly financials because those reports don’t provide much insight into running the business. One key turning point for many firms is developing a management view of their financials, learning to understand the basic levers they need to manage, and building a discipline of monthly financial reviews from a business management perspective. You need a management view of your financials.
The first step to comparing your results with best-in-class performers is using a uniform, detailed structure for measuring revenue, cost, and profitability.
To do this, Service Leadership developed the Normalized Solution Provider Chart of Accounts™, which provides IT solution providers with practical visibility into the true financial and operational drivers of their business, and all stakeholders with a common method of measuring true profitability and growth.
The normalized chart of accounts enables the effective management of an IT solution provider business by allowing managers to understand which parts of their business are producing profit, which parts are producing loss, and why. Only when this insight is available can managers take targeted action and measure the results.
Properly organizing your chart of accounts—and building the discipline to categorize transactions consistently—allows a leader to see how well they are managing resources. For example, service gross margin is a primary driver of profitability. Properly aligning all service-related labor costs into the correct cost of goods sold (COGS) accounts gives a manager a true measure of performance against historical results and against the rest of the industry (when done in the context of the Service Leadership Indexing Service).
Many leaders make mistakes as they build their business, which results in plateaued growth. Some common mistakes include:
Each of these leads to an EBITDA that does not allow for proper investment back into the business to ensure continued growth.
We often hear, “I’m not as profitable as I’d like, but we’re going to sell our way out of that problem, and I’ll be more profitable when we’re larger.” The reality is that doesn’t happen. What does happen is that you build systems, processes, and behaviors that reinforce a sub-par performing business.
The hard truth is that you must get to a solid financial performance model, and then the growth will come.
What does that look like?
These practices will result in a regular growing pool of gross margin dollars.
Managing your spend on sales, general, and administrative (SG&A) expenses relative to that pool of gross margin dollars ensures a consistently healthy EBITDA.
As you grow your pool of gross margin dollars, building discipline to spend only a portion of each incremental gross margin dollar on SG&A helps ensure continued strong financial performance with sustainable best-in-class results.
There are no shortcuts.
Whether you are a sole proprietor or a private equity-owned IT solution provider, there is a top-down approach to building a strategy and operationalizing it to achieve the desired results. Spending the time to define the desired outcome at the beginning of that process will help ensure that the hard work of the daily grind of running your business will lead you to that successful outcome.
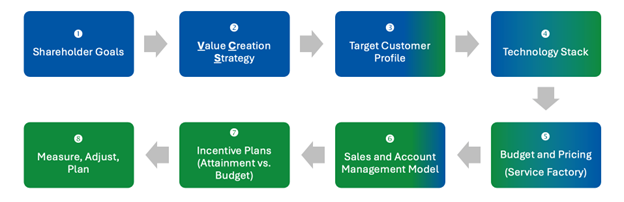
Figure 2: How to build a "service factory" to meet your goals
Profitability comes from a clear objective, clearly aligned with your target customer profile, a narrow enough and disciplined technology stack, and a set of operational systems, behaviors, and measurements that allow a business to meet its goals. The cleaner those definitions, the more streamlined the business becomes. The image above reflects how to build a “service factory” that is set up as simply as possible to create the most effective and profitable service delivery that will help you meet your goals. More variables and more offerings require more tools and systems, which add complexity of execution and drag to performance. Being clear and focused about your target customer profile, technology stack, service offering, compensation models and incentive plans, and the required measurements is key to operational maturity, sustained growth, and profitability.
A value creation strategy (VCS) is the paramount operational maturity trait. It creates the necessary clarity and alignment that forms the foundation that underpins successful solution providers.
Some VCS realities:
It starts with where you are today and your future value creation goal:
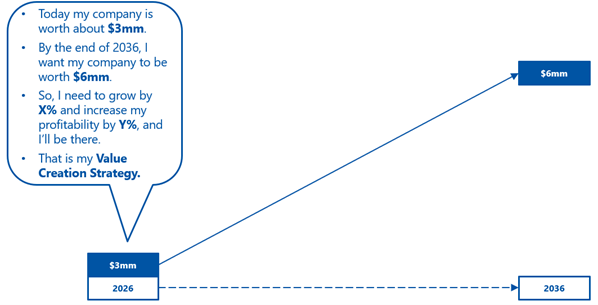
Figure 3: Building a 10-year value creation strategy
Your VCS will define what must happen between now and the target date to ensure progress towards that goal.
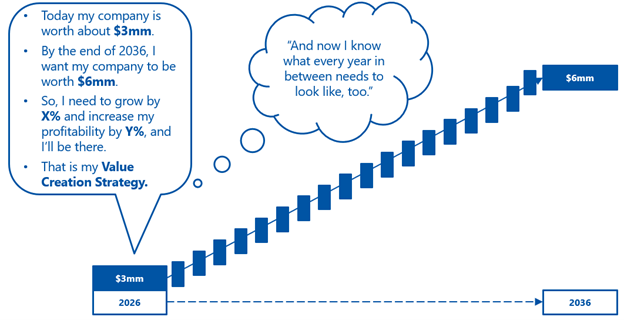
Figure 4: Steps to achieve your 10-year value creation strategy
A value creation strategy takes owner or shareholder goals and creates the structure of a plan with enough clarity to enable proper definition of target clients, technology stack, offerings, etc. All these operational details, and many more, must be managed to achieve the desired objectives.
Once you have your value creation strategy, you are ready to define your target customer profile, which informs your technology stack, your offerings, your sales approach and incentive plans, and your other operational activities. None of this is possible without understanding your goal.
Operational maturity is the strongest predictor of profitability, service quality, and valuation in alignment with your goals. OML provides a maturity ladder across financials, service, sales, strategy, compensation, and security/compliance. Improving OML should be a deliberate, sequenced process and not a set of ad‑hoc initiatives.
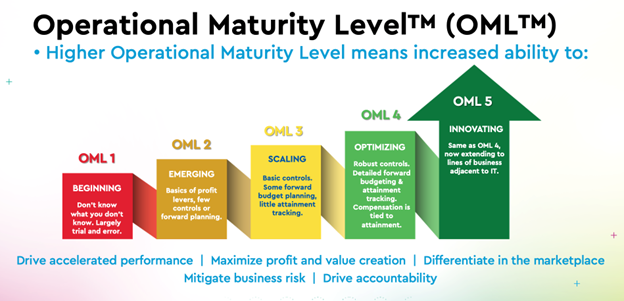
Figure 5: The five stages of operational maturity level (OML)
Many IT solution providers have adopted operational systems, such as the entrepreneurial operating system (EOS), for example, to help identify areas of improvement and run their business better. An OML-oriented approach ensures the work you are doing to improve your business is not simply replacing one system or process with another, but that, as you improve systems, the new ones are more mature, more scalable, and more aligned with the “service factory” thinking that best-in-class providers strive for.
The 20+ years of data we’ve compiled from the Service Leadership Index has proven there is a strong correlation between OML and EBITDA.
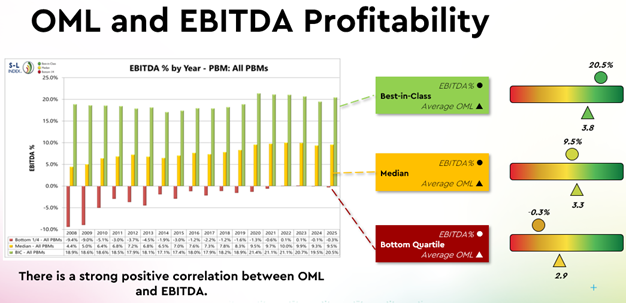
Figure 6: Strong positive correlation between OML and EBITDA
Particularly as a business approaches and exceeds an OML of 3.0, we begin to see marked improvement in EBITDA percentage and consistency in profitability. As a business surpasses an OML of 3.0, it will have developed the mindset and relevant processes supporting the “service factory” concept, which better enables the business to scale. As OML improves to 3.8 or higher, we typically see BIC profitability as the norm.
Many owners lack a group of qualified advisors who understand the situations they regularly deal with, and with whom they can interact to explore and share ideas. They also typically lack serious accountability (unless they have a strong board) in executing the decisions they make. Peer groups are an ideal place where you can compare financial performance, discuss ideas, learn from others’ experience and share yours, and build a trusted group of advisors. A peer group can understand what you want from your business and help you achieve your goals. Service Leadership data shows a material difference in metrics like compound annual growth rate and EBITDA improvement when a business is part of a peer group. ConnectWise has a few options for you, as referenced in the next section – The Path Forward.
Profitability is a skill that can be learned, not a stroke of luck.
Let’s sum up the First Principles of Service Leadership.
ConnectWise owns and manages the IT Nation Evolve peer group community. Under this community, there are two different group options:
Both include the S-L Index benchmarking tool as well as the SLIQ OML progression tool.
While none of these concepts are inherently difficult to understand, doing them well – especially by yourself - can be difficult. Service Leadership has built tools and services that can help.
For benchmarking, we have the fully Service Leadership Indexing Service and, for the smaller partners just getting started, the new Benchmarking Essentials benchmarking product.
To improve your Operational Maturity Level, we have a SaaS (software as a service) offering called SLIQ. SLIQ leads you and your team through an OML assessment of your entire business. It then builds an Action Plan which prioritizes which traits you should focus on, in order of ROI, for maximum improvement. Guidance on how to proceed for each trait and each maturity level is provided as well. SLIQ also comes with a Value Creation Tool, guidance on Target Customer Profile, and a BIC-o-meter, which allows you to see what OML improvement will lead to financially.
You can learn about those tools on our website.
For peer groups, we have a few offerings. We have OML groups that focus on operational improvement, and we have the Evolve peer groups, which take a more holistic approach. Evolve adds components beyond operational improvement, including building leaders and managers and balancing your business with family and life considerations, among other things. Beyond the value of relationships and community, peer group memberships also include the benchmarking and SLIQ tools mentioned above, which we use to help you grow.
Our industry and the world are moving fast. Being consistently profitable puts you in a position to adopt and change as AI progresses. Adopt our learnings from over 20 years of measuring what the best, most profitable companies are doing and become best-in-class yourself.
Share: