

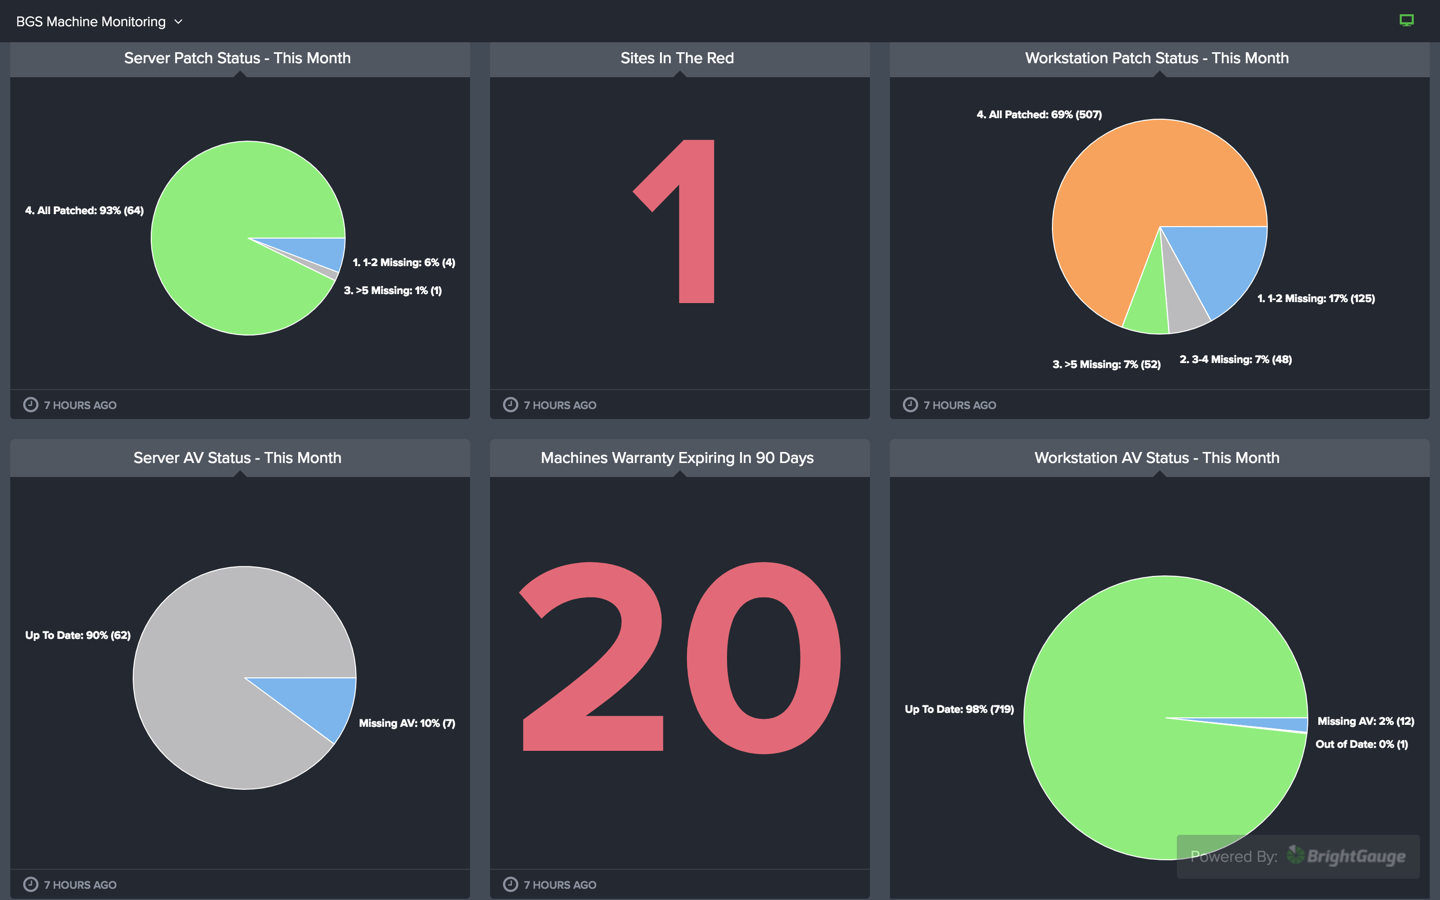
Reports and Dashboards (formerly BrightGauge) simplifies data consumption through centralization and visualization
Reports and Dashboards (formerly BrightGauge) puts your most important data points in one place so you can make faster, sharper business decisions.
Reports and Dashboards (formerly BrightGuage) + Your Data
Simplify data for all stakeholders with Reports and Dashboards (formerly BrightGauge)
Connect your integral business tools into Reports and Dashboards (formerly BrightGauge) to create dashboards based on different stakeholder needs, including the ability to bring data from different sources together.
Learn more about our dozens of integrations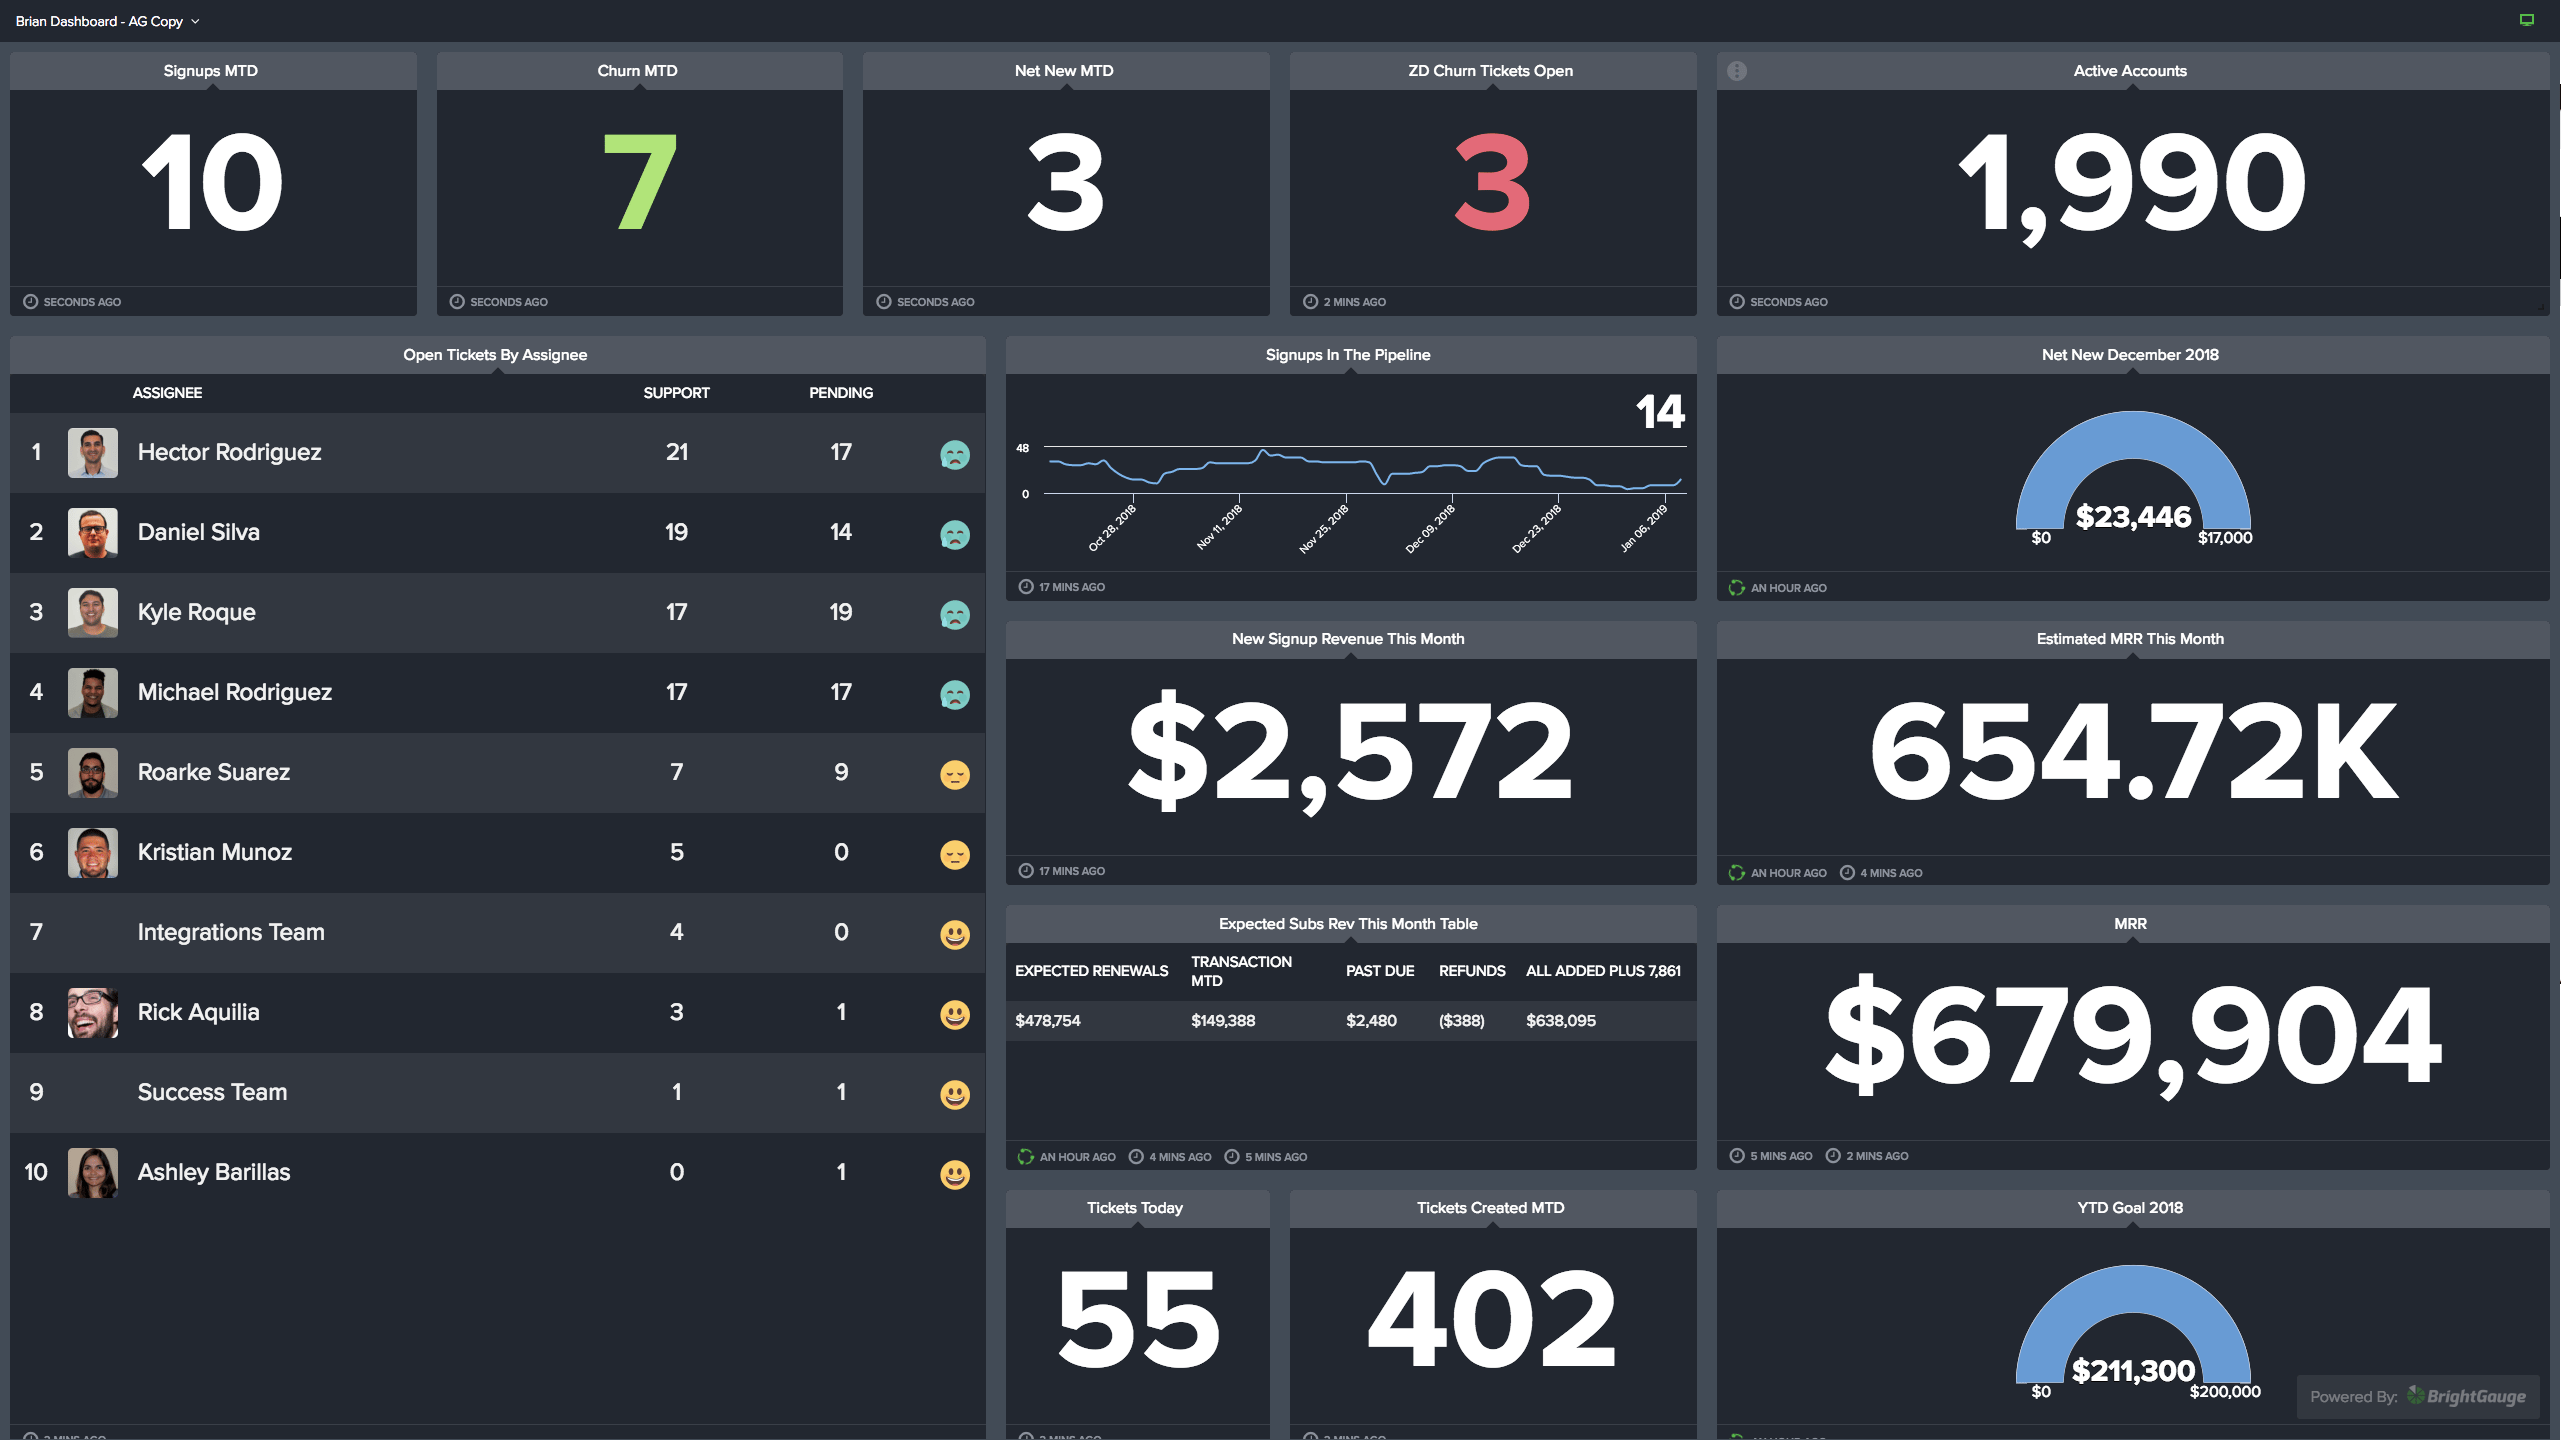
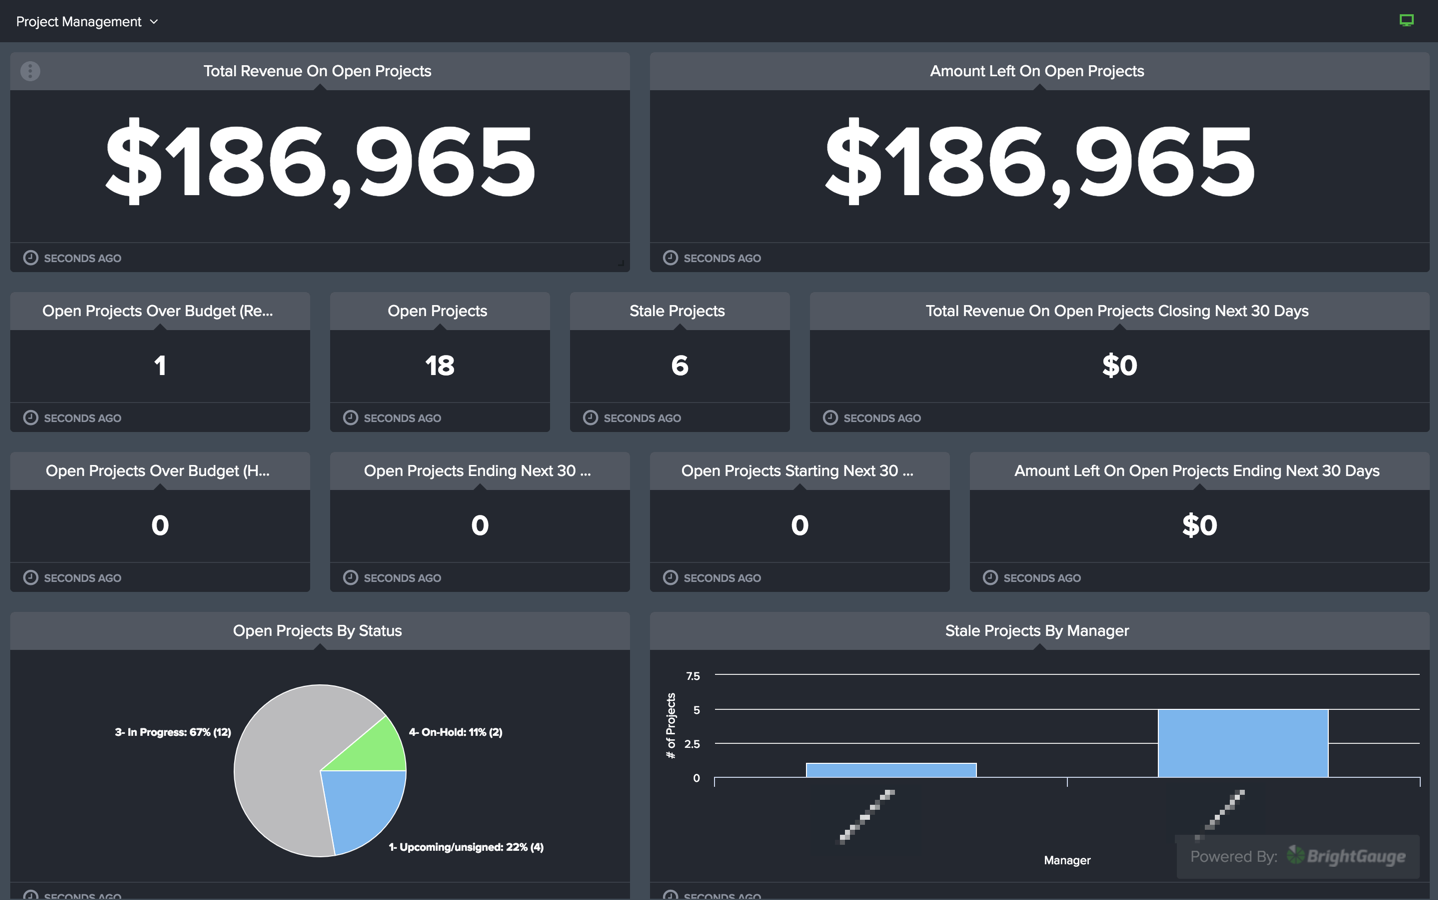

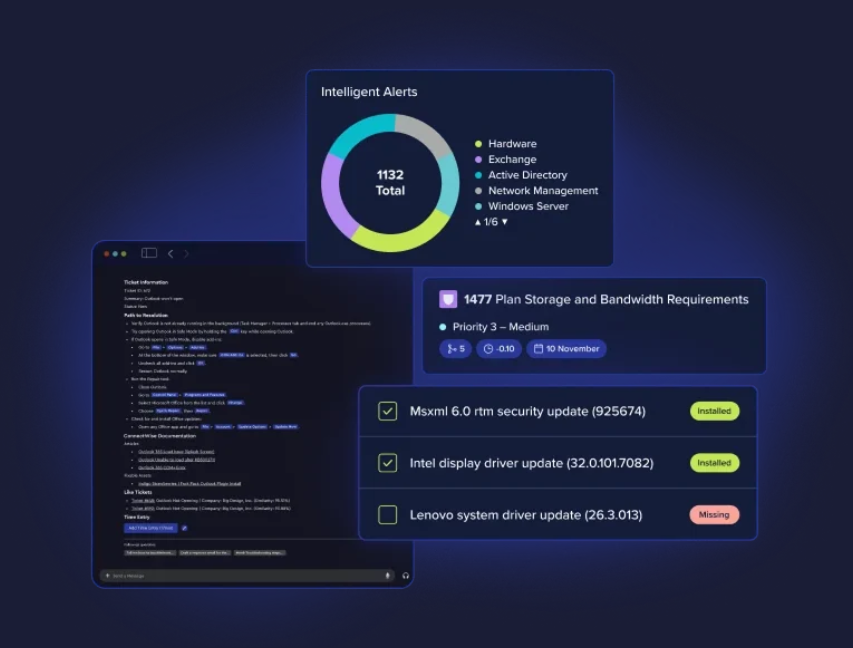
Custom KPIs
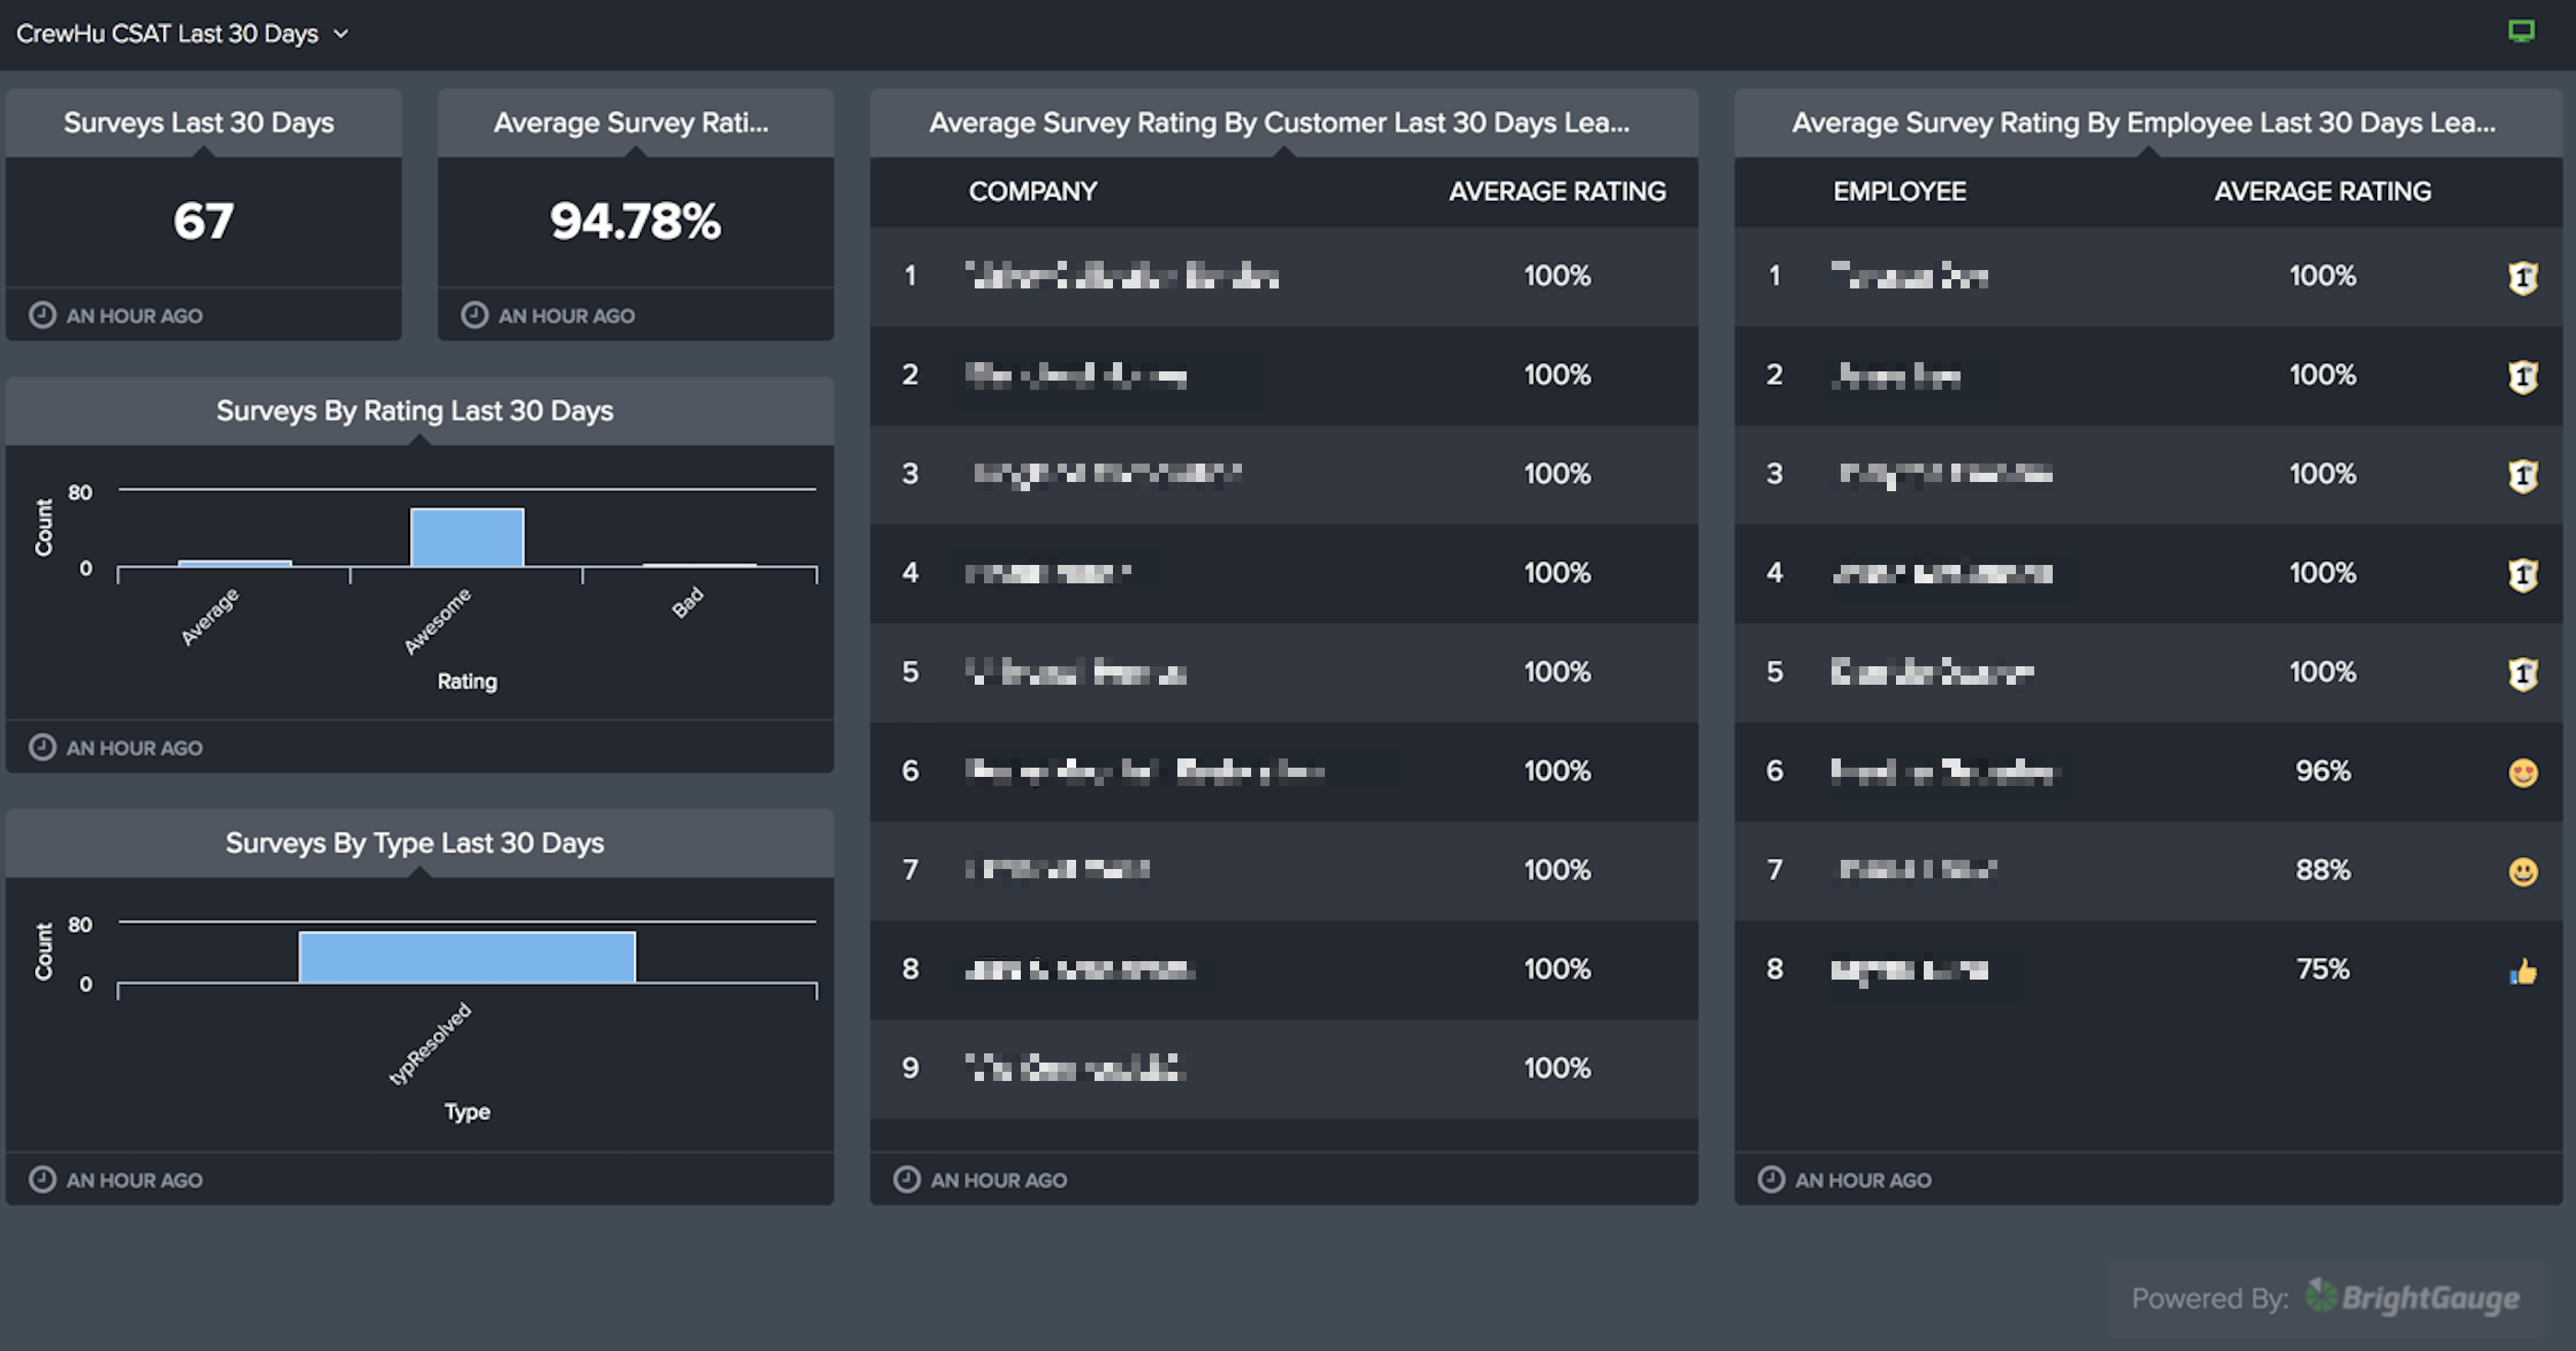
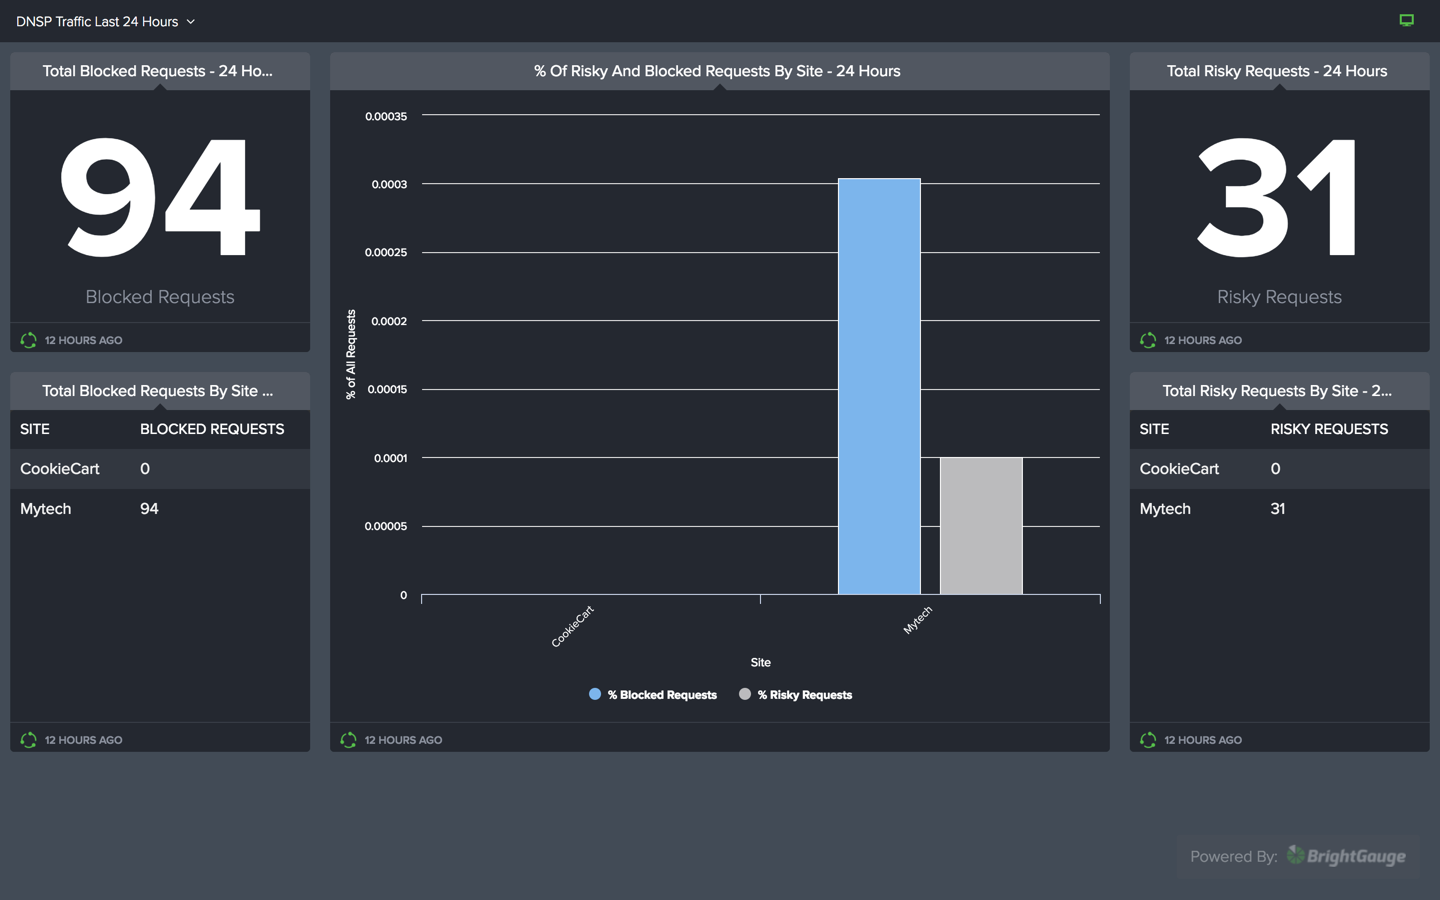
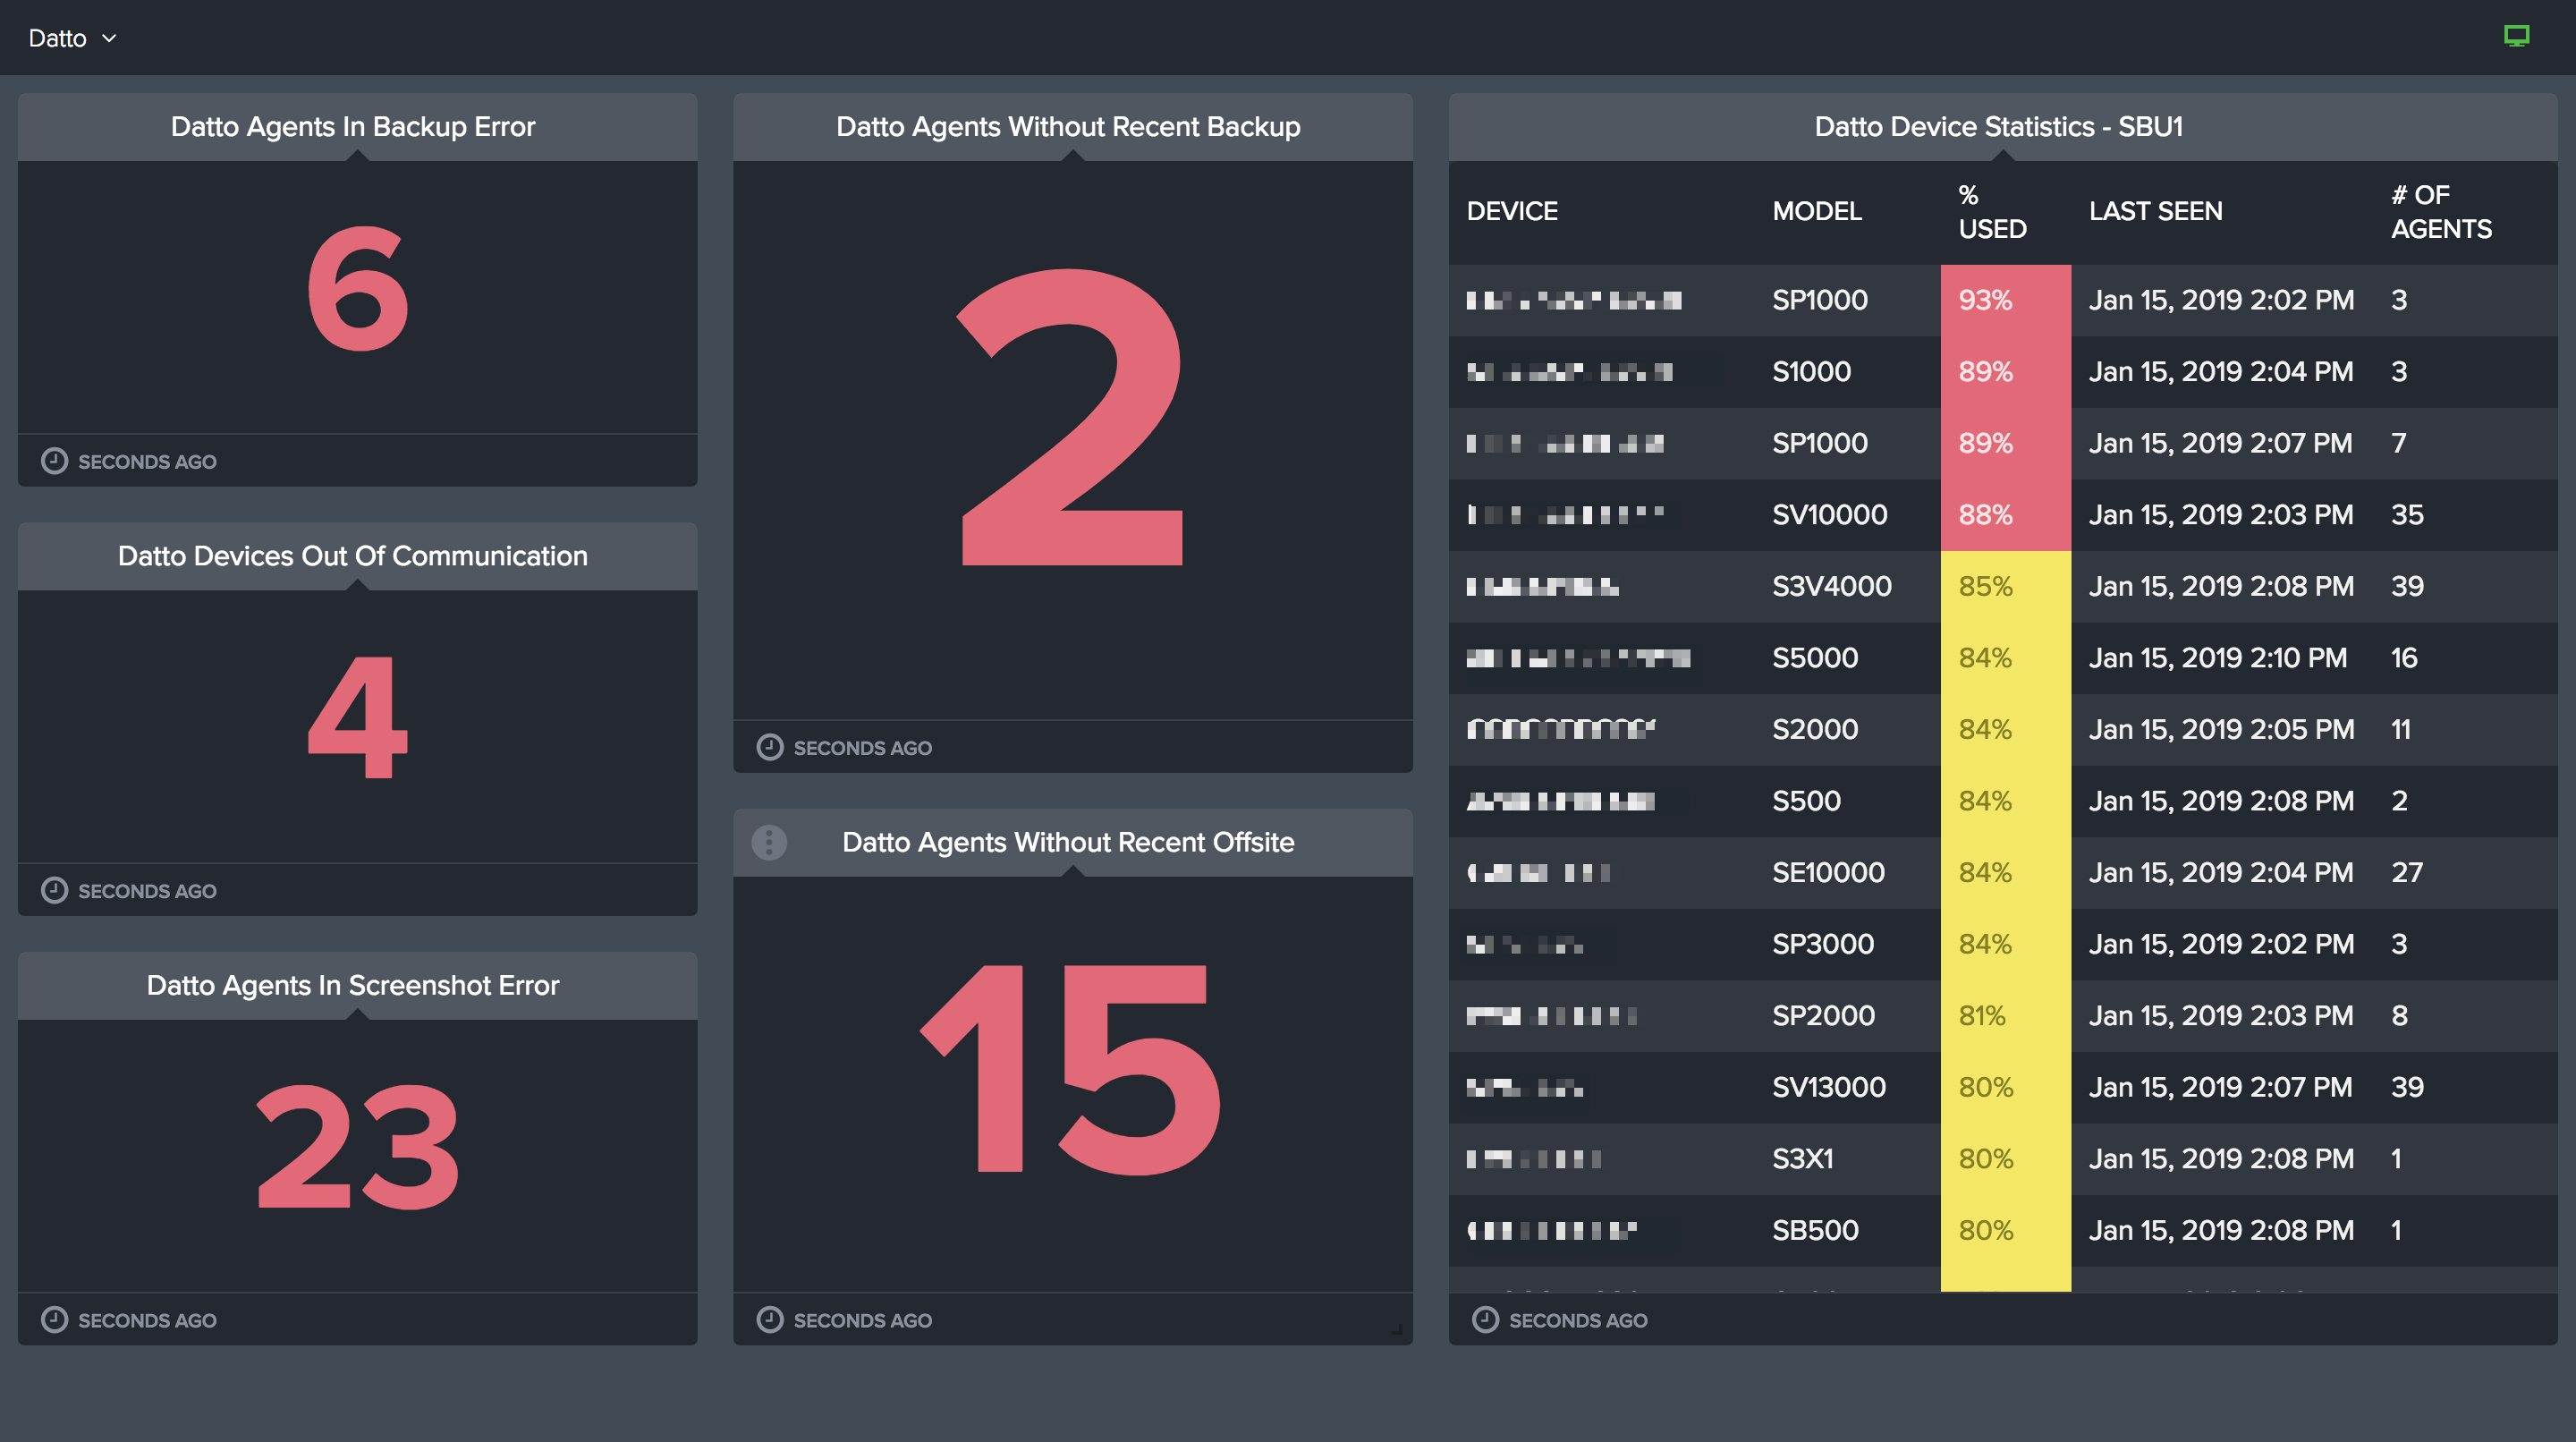
All of our integrations come with pre-built default gauges so you can hit the ground running. Whether you're starting with a default gauge, or building one from scratch, gauges can be customized exactly how you like. Its your data - see it displayed however makes the most sense for your business.

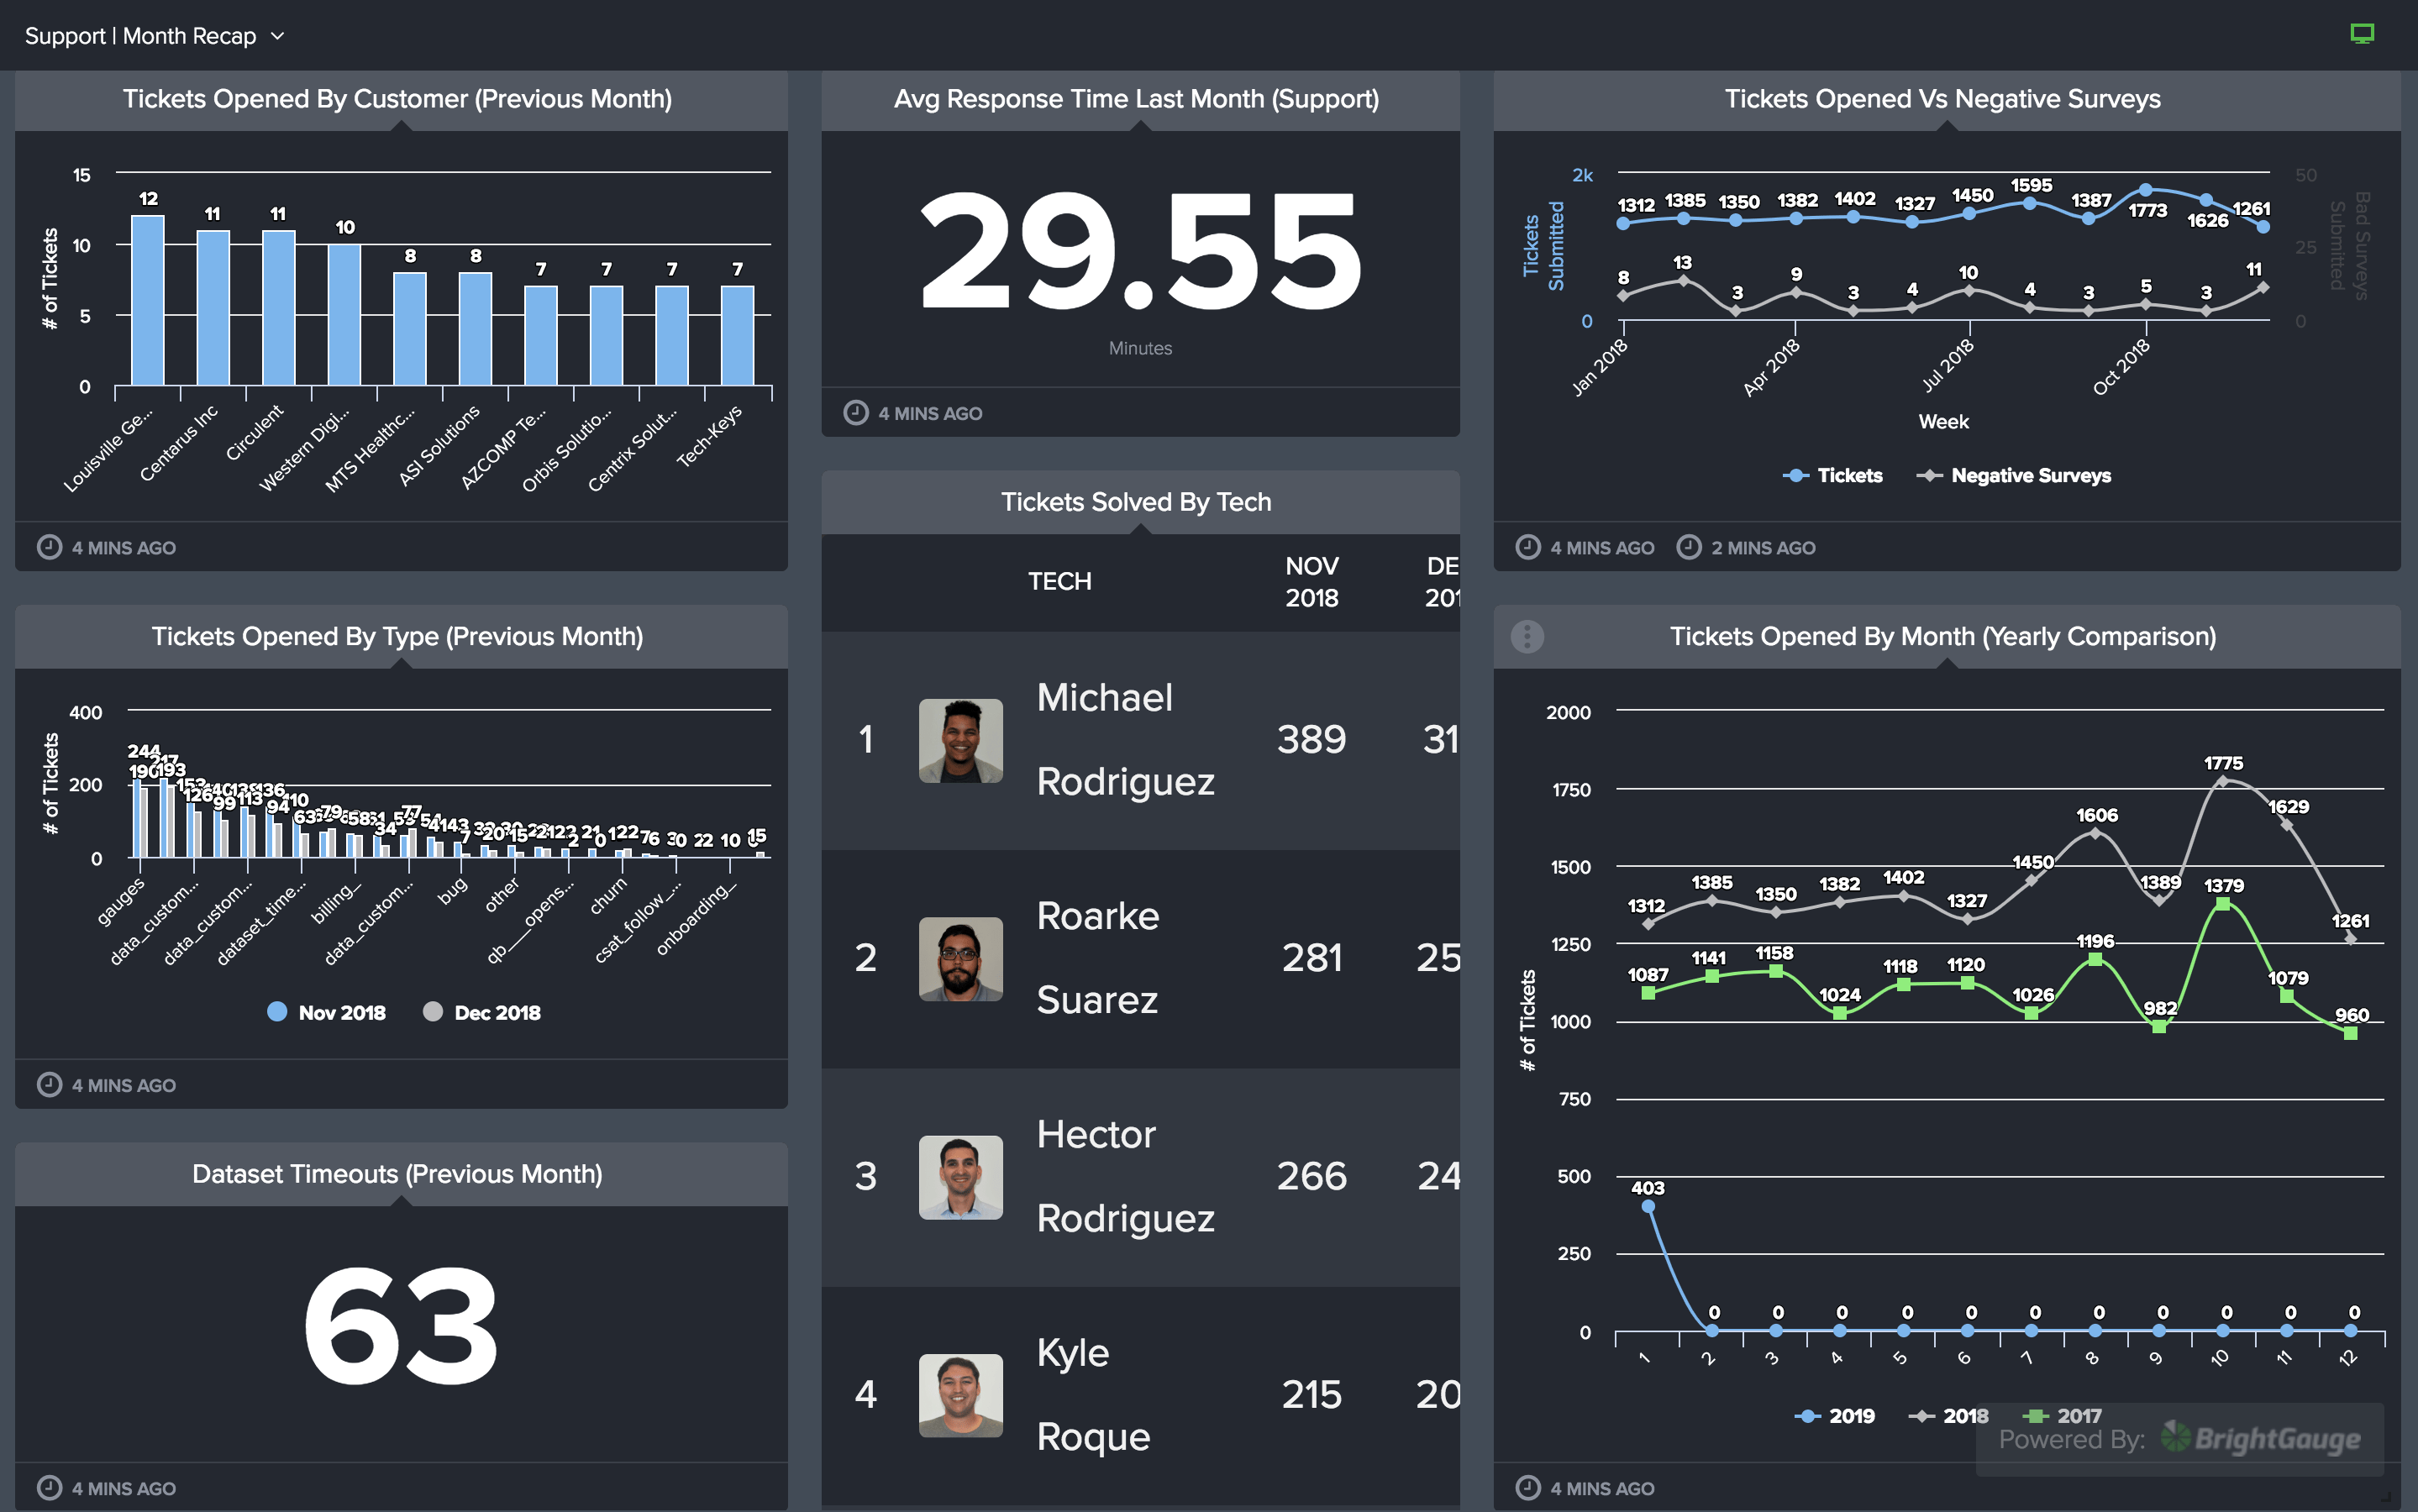
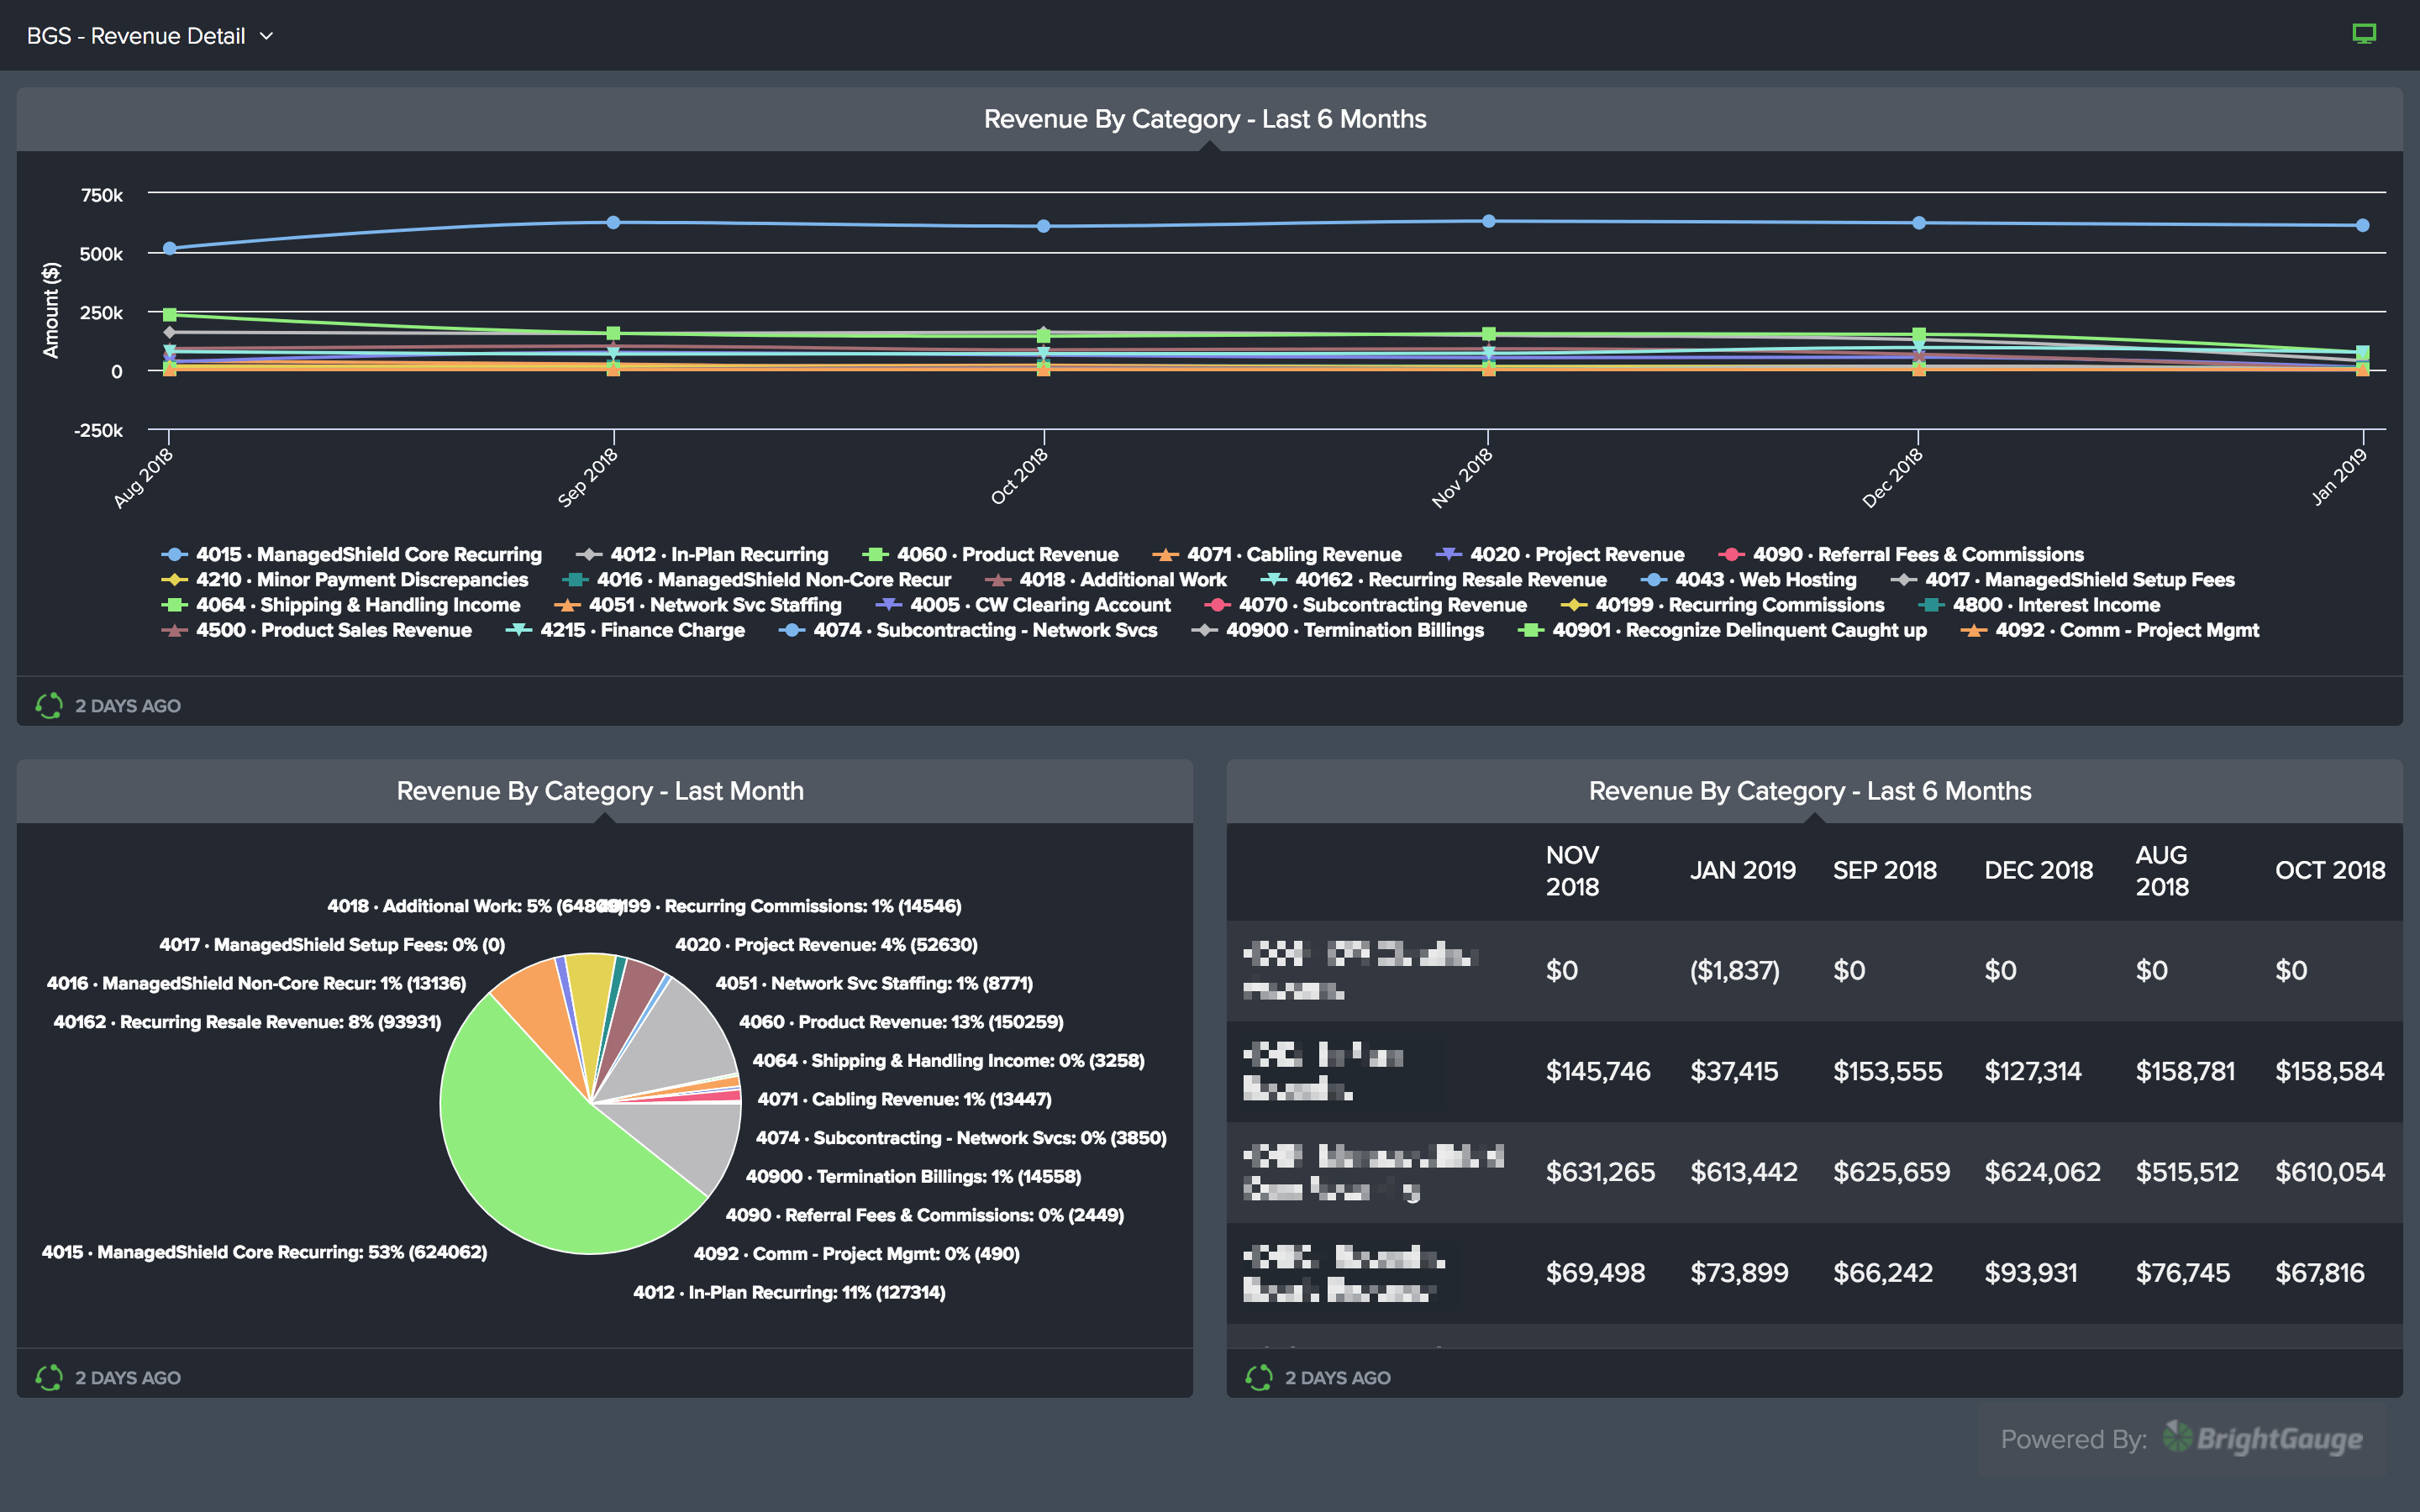
Snapshots
Snapshots is your data warehousing lite solution. With Snapshots, store data your PSA, RMM, or other systems won’t. Snapshot gauges automatically take a daily, weekly, or monthly picture of your metrics - like end-of-day ticket count - and pin it onto a chart. After a while, you’ll be able to look at your Snapshot gauge and identify any patterns or issues.
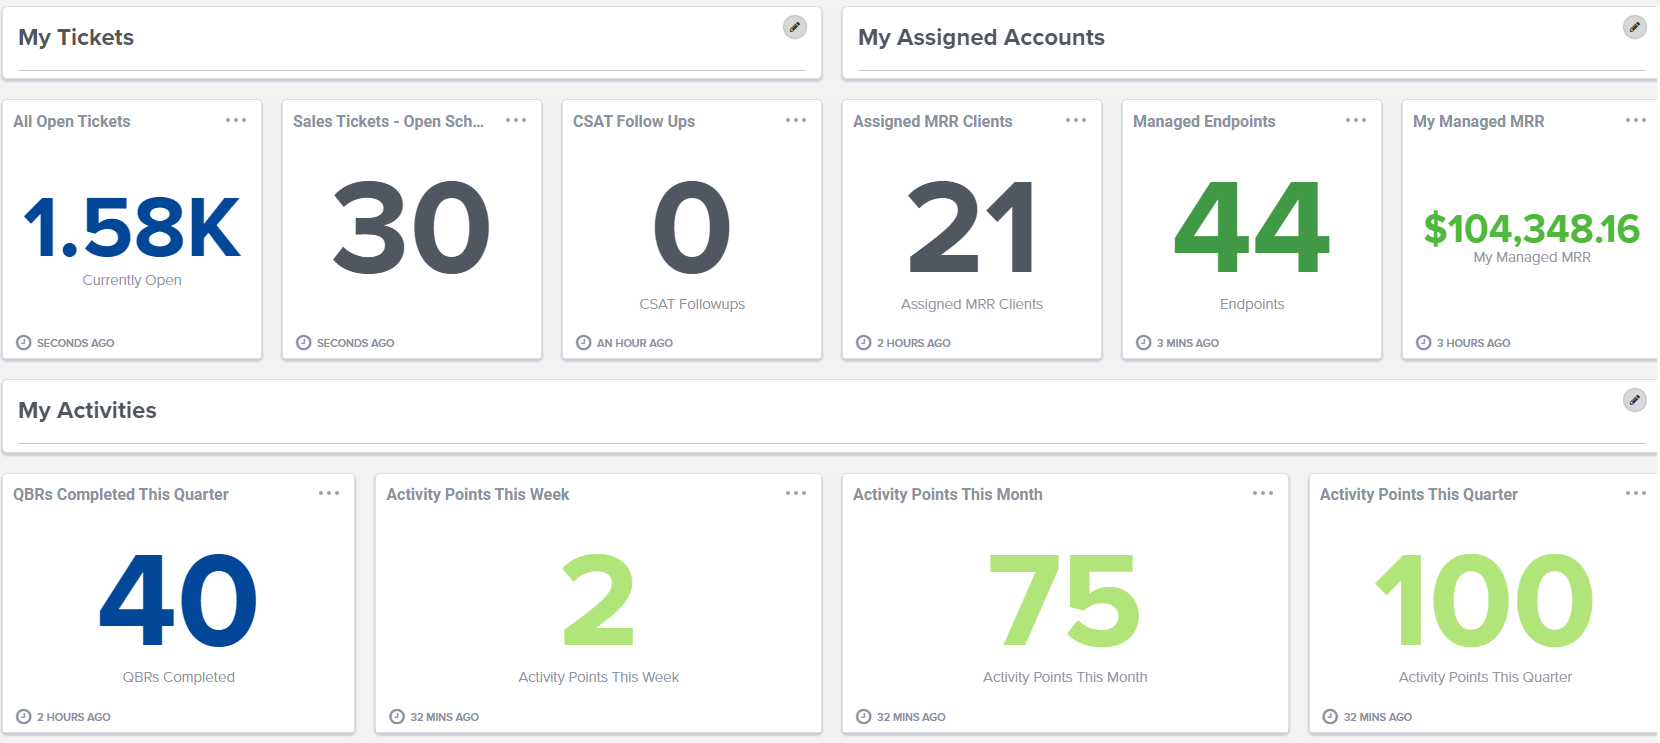
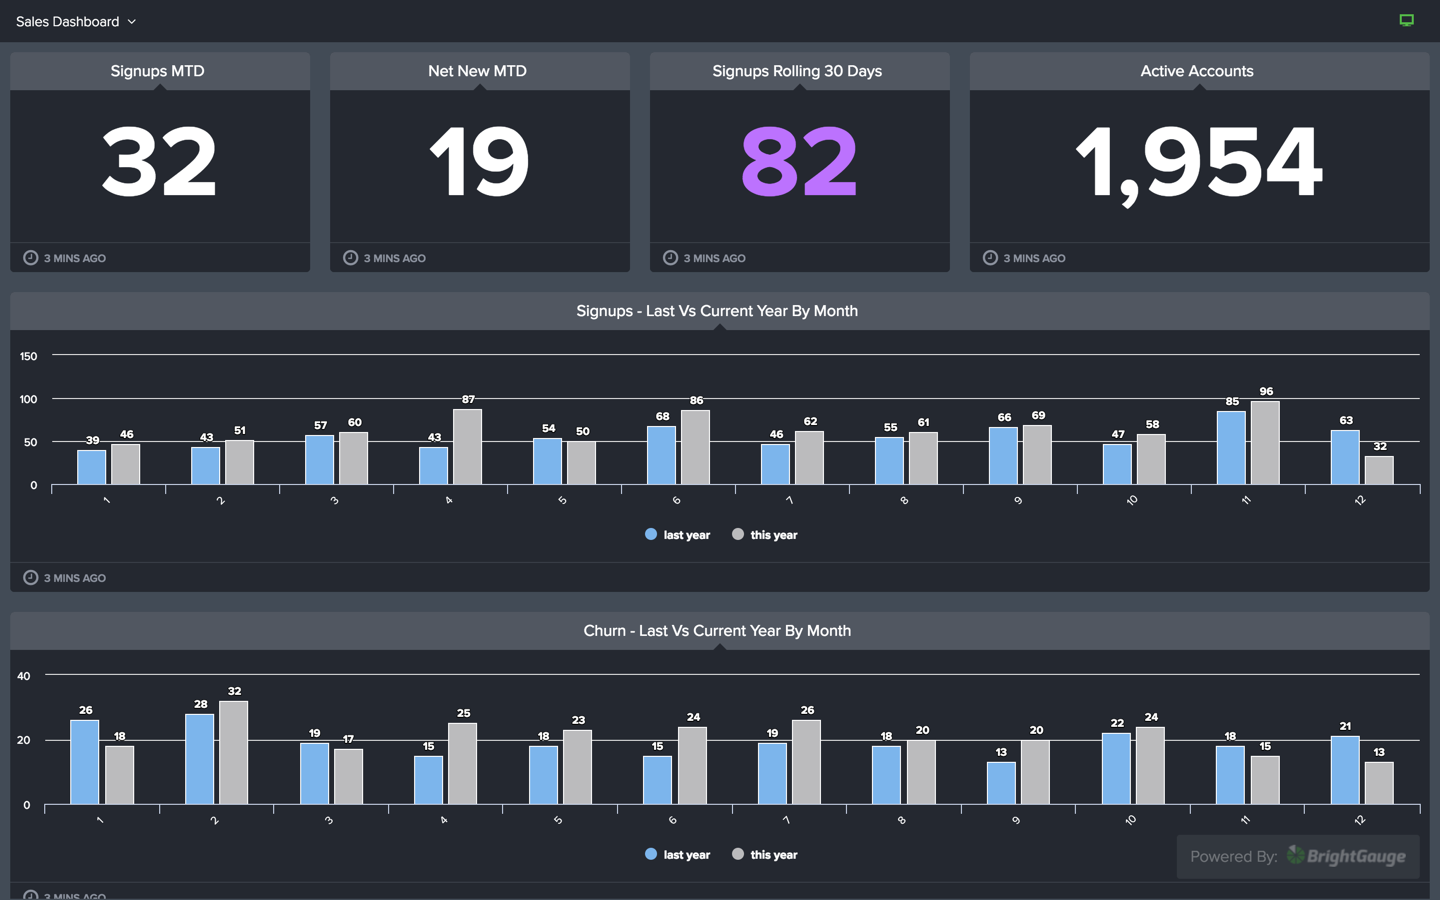
Dashboard Versatility
Dashboards in Reports and Dashboards (formerly BrightGauge) help drive a culture of accountability and action internally, but dashboards can also be extended to your customers. Share beautiful dashboards with customers to help drive customer satisfaction, retention, and business growth for both you and your customers.