Helpful Resources
Live demos
Trials
Resources
Request pricing
Get Support
Request a Quote
PSA
RMM
ScreenConnect Remote Access
zofiQ Agentic AI
RPA
CPQ
Payments
SIEM
Managed EDR
M365 Cloud Backup
M365 SaaS Security
x360Recover
x360Cloud
Vulnerability Management
Email Security
Platform Overview
Sidekick
Documentation
Reporting
Customer Feedback
MSPs
IT Departments
Managed Print
VAR
Client Onboarding
Service Desk Ticketing
Cyber Remediation
Billing Reconciliation
Patch Management
Endpoint Management
Business Management
Unified Monitoring & Management
Cybersecurity & Data Protection
BCDR
Expert Services
Webinars
Blog
eBooks
Case Studies
On-demand Demos
Live Demos
Cybersecurity Glossary
University Log-in
Product Training
Support Docs
IT Nation Connect Global
IT Nation Connect Europe
IT Nation Connect ANZ
IT Nation Evolve
Service Leadership
IT Nation Grow
PitchIT
Roadshows
Mission & Values
Careers
Leadership
Board of Directors
Press Room
Awards
100 result(s)
Filters
Applied Filters
Unlock an even more powerful PSA. Explore the updated PSA experience and see how Asio, the first true purpose-built platform for MSPs, can help you work smarter and scale faster.
See how ConnectWise PSA allows MSPs to better manage their sales and marketing efforts with a state-of-the-art CRM solution. Watch the demo!
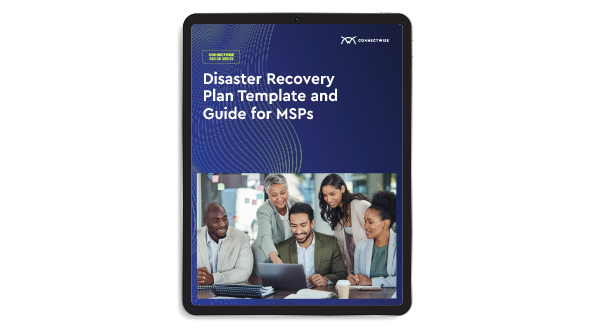
Learn everything you need to know about creating a disaster recovery plan for your business and access templates that help simplify the process.
Learn how Network Operations Center (NOC) services can help MSPs expand their bandwidth, improve customer service, and help free up internal technicians’ valuable time.
On March 11, 2020, the World Health Organization (WHO) declared the coronavirus (COVID-19) outbreak a global pandemic. 5 years later we reflect on how MSPs played a pivotal role in saving the world.
Take an in-depth look at managed IT services. Gain a further understanding of what they are, how they began, and what you can do to provide your clients the best service imaginable.
Confused about service desk vs help desk vs ITSM? Learn the key differences, benefits, and how each fits into IT support and management.
See how ConnectWise CPQ integrates with Ingram Micro products. Learn more!
Discover the future of MSP success with ConnectWise PSA™ on the Asio platform. Enjoy a unified interface, AI-enhanced automation, and seamless integration for better efficiency and growth. Learn what’s changing and how to activate your PSA in Asio today!